Marketplace Growth Strategy: How to Build Liquidity First
Liquidity, Trust, and Revenue Expansion
Marketplace growth strategy is the operating discipline of sequencing liquidity, trust, and revenue decisions in the correct order for a two-sided platform. It differs from a standard growth strategy because the constraints are structural. You cannot monetize what hasn’t matched. You cannot build trust on top of a platform that participants don’t yet use. And you cannot scale what neither side believes in.
Most marketplace operators know this in theory. They violate it in practice.
Gross Merchandise Value (GMV) grows. Revenue yield stays flat. The take rate looks like a monetization problem. It isn’t. It’s a trust issue that wasn’t apparent during the early-stage acquisition. Or a match rate problem that got buried under supply volume. The sequence was wrong from the start, and now the platform is paying for it.
I first saw this sequencing pattern clearly while working on marketplace-scale growth environments like Realtor.com, where liquidity thresholds consistently predicted revenue expansion earlier than transaction volume did.
I later encountered the same constraint inside the MyEListing real estate investment marketplace. The platform had supply. It had demand. Revenue was not following. When we pulled the data, the constraint wasn’t acquisition. It was match quality and trust-signal infrastructure that had been deprioritized during the growth push.
This article introduces the Marketplace Growth Operating Model: a three-layer framework that sequences liquidity architecture, trust systems, and revenue expansion in the order that actually works. It builds on the foundation of a growth strategy operating model — but applies it to the structural constraints unique to two-sided platforms. It explains what happens when you get the order wrong, and how to diagnose which layer is blocking your platform right now.
What Marketplace Operators Get Wrong About Growth

The most common mistake is treating marketplace growth like funnel growth.
A standard growth loop design optimizes conversion through a linear path: acquire leads, nurture, convert, retain. The metrics are relatively independent. CAC doesn’t break LTV. Retention doesn’t require liquidity. You can optimize each stage separately.
Marketplace growth doesn’t work that way. The stages are interdependent. Supply acquisition without match quality doesn’t produce liquidity. Liquidity without a trust architecture doesn’t produce conversion. Conversion without structural revenue systems doesn’t produce yield. Every stage depends on the previous one being done correctly.
The second mistake is optimizing the take rate before the trust layer is solid. I’ve watched this one play out more than once. A platform has a reasonable transaction volume, decides it’s time to increase revenue per transaction, and raises the take rate. Conversion drops. The platform interprets this as price sensitivity. It isn’t. It’s signal sensitivity. Participants were already uncertain about the platform’s reliability. The take rate expansion removed the last reason to absorb that uncertainty.
The third mistake is confusing supply volume with liquidity. A marketplace can have thousands of listings and still have a liquidity problem. Liquidity isn’t inventory. It’s the match rate. If supply exists but matches aren’t forming reliably, the platform is pre-liquidity regardless of how much is listed.
| What is a marketplace growth strategy? Marketplace growth strategy is the operating discipline of sequencing liquidity architecture, trust systems, and revenue expansion in the correct order for a two-sided platform. Unlike a standard growth strategy, each layer depends on the prior layer being functional before it can scale. Optimizing revenue before achieving reliable matching, or building trust systems before supply and demand are balanced, consistently stalls platform growth before scale. |
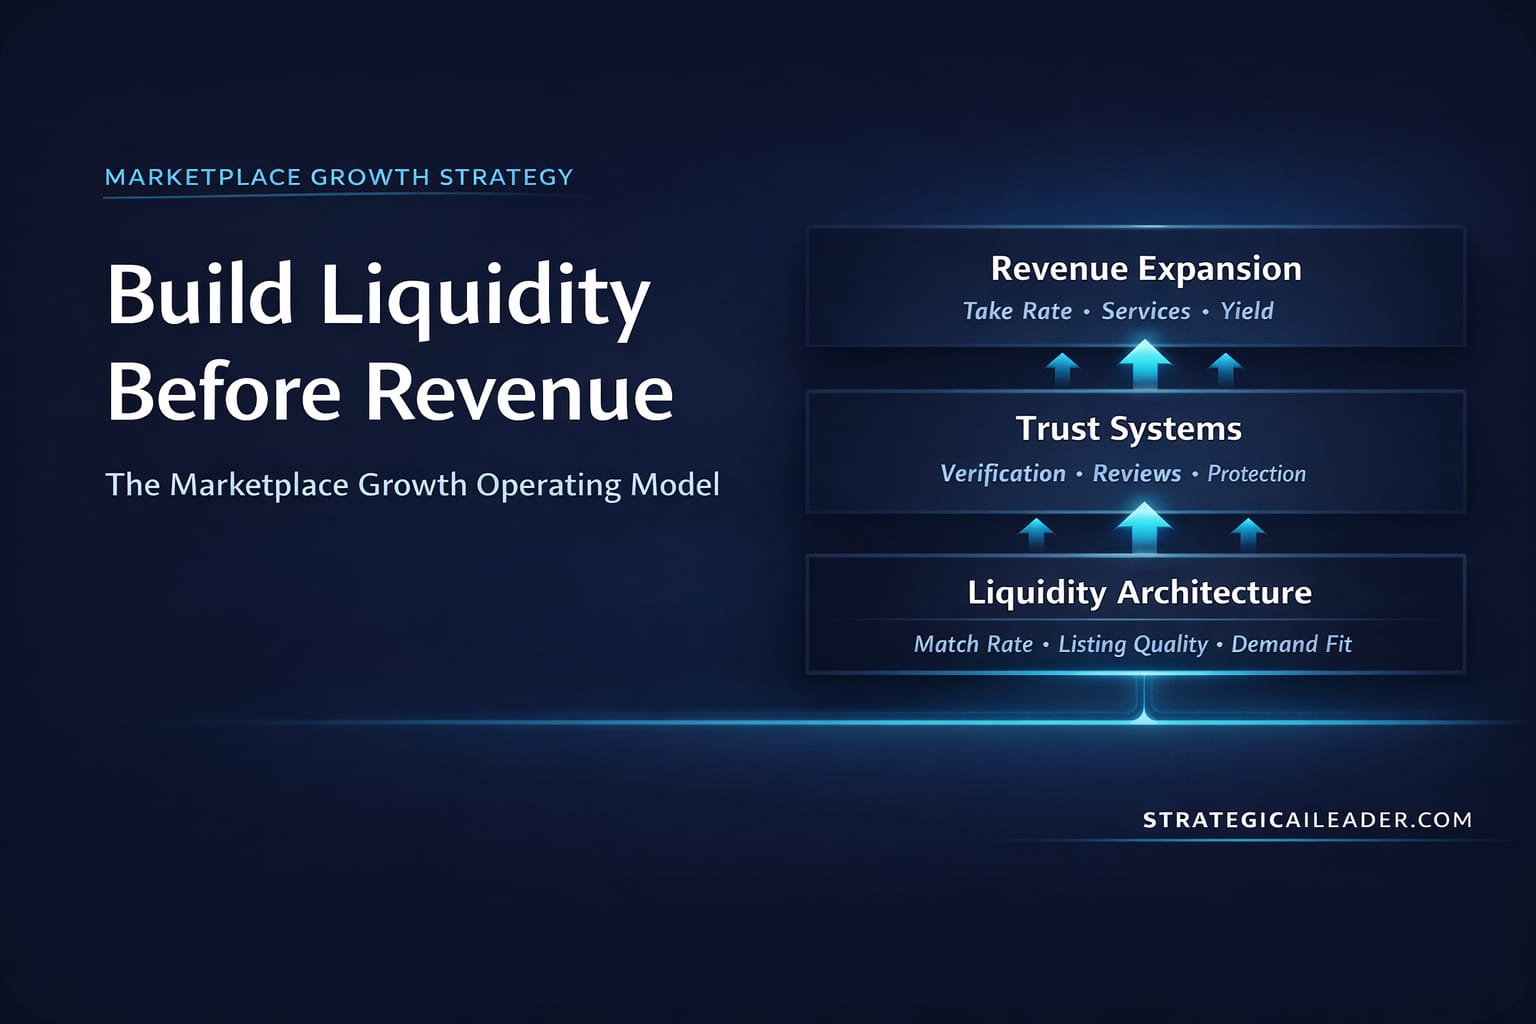
The Marketplace Growth Operating Model

systems and revenue expansion for two-sided platforms to scale reliably
| Marketplace Core Metrics Match rate: the percentage of participants who successfully find a viable counterparty or opportunity after entering the marketplace. Trust signal: a composite measure of participant confidence that transactions on the platform are accurate, legitimate, and protected. It reflects verification coverage, listing accuracy, review reliability, dispute resolution performance, and perceived transaction safety. Take rate: is the percentage of transaction value a marketplace captures as revenue. It measures how much the platform earns from each completed transaction relative to total transaction volume. Gross Merchandise Value (GMV): measures total transaction volume flowing through the marketplace. GMV growth without take rate expansion usually signals a trust or match quality constraint, not a monetization problem. |
The Marketplace Growth Operating Model organizes marketplace growth into three sequential layers. Each layer has a distinct function, distinct metrics, and a distinct failure mode. The layers must be addressed in order.
Layer 1 – Liquidity Architecture
Liquidity architecture is the operational work of achieving reliable, repeatable matching between supply and demand. The liquidity threshold is the point at which a participant on either side of the platform has a reasonable expectation of finding a match when they show up. Below that threshold, the platform is pre-commercial regardless of the amount of traffic it receives.
I expected liquidity to be primarily a volume problem. It wasn’t. The MyEListing data showed the bottleneck wasn’t the supply count. It was listing accuracy. Investor Match Rate improved 28% after we addressed listing quality and verification, not after we added more listings. The matching infrastructure mattered more than the inventory size.
The liquidity layer includes supply acquisition, demand acquisition, match-rate optimization, and a threshold gate that determines when the platform is ready for trust investment. Skipping to Layer 2 before the threshold is crossed doesn’t accelerate growth. It wastes trust architecture investment on a platform that isn’t producing matches.
Layer 2 – Trust Systems
Trust systems are the structural components that reduce perceived transaction risk. They include identity and verification layers, review infrastructure, dispute resolution mechanisms, and the trust signal the platform emits to participants considering their first or next transaction.
Trust isn’t assumed. It’s engineered. The MyEListing Internal Trust Signal increased from 65% to 90% following deliberate architectural changes. That wasn’t the result of better marketing or more volume. It was the result of building the verification and review systems that gave participants a reason to believe the platform would protect them.
Most platforms try to bolt trust infrastructure on after churn has already started. That’s the wrong sequence. Platforms that build trust architecture before they need it grow faster than those that respond to trust problems after the fact. The cost of reconstruction is higher than the cost of building it right the first time.
Listing Accuracy improvement from 92% to 96% – a four-point structural input change drove the 28% Investor Match Rate improvement. The accuracy of the underlying data powered the match quality. That’s a trust infrastructure decision, not a volume decision.
Layer 3 – Revenue Expansion
Revenue expansion is the work of increasing platform yield per transaction. This includes a take-rate baseline, take-rate optimization, and value-added services layered on top of a platform that has already achieved reliable matching and participant trust.

The sequencing here is non-negotiable. Take rate expansion on a platform that hasn’t crossed the liquidity threshold usually kills the match rate. Take rate expansion on a platform with a weak trust signal usually kills conversion. But take-rate expansion on a platform that has done Layers 1 and 2 correctly produces compounding returns because the platform delivers demonstrable value that participants are willing to pay for.
The MyEListing Conversion Rate Lift of 47% didn’t come from a take rate adjustment. It came from the downstream consequence of getting Layers 1 and 2 right. When matching worked, and participants trusted the platform, conversion followed. That dynamic is the second-order revenue flywheel at work: structural platform improvements compound into revenue without requiring proportional spend. The revenue expansion was available precisely because the operating model had been sequenced correctly.
| What are the three layers of the Marketplace Growth Operating Model? The three layers are Liquidity Architecture, Trust Systems, and Revenue Expansion. Liquidity Architecture establishes reliable matching between supply and demand. Trust Systems reduce perceived transaction risk through verification, review infrastructure, and dispute resolution. Revenue Expansion captures yield from a platform that has already demonstrated reliable matching and participant confidence. Each layer depends on the prior layer being functional before it can scale. |
Applied: How MyEListing Sequenced the Model
MyEListing is a real estate investment marketplace. The business connects investors with listed properties through a matching and verification system. Early growth produced an adequate supply and demand, but revenue yield per transaction was not tracking GMV growth.
My initial assumption was that the problem was in the revenue layer. Take rate structure, monetization architecture. I was wrong.
When we audited the operating model, the constraint was in Layer 2. Listing accuracy was at 92%. Trust Signal was at 65%. Those aren’t catastrophic numbers, but they’re pre-commercial for a platform expecting participants to transact at scale. Match quality was being undermined by data quality. Participants who showed up and found imprecise listings left before converting. The trust signal wasn’t strong enough to absorb that friction.
We rebuilt the trust infrastructure first. Verification layers tightened. Review systems expanded. Listing accuracy moved to 96%. Trust Signal moved to 90%. Investor Match Rate improved 28%. Those changes weren’t marketing investments. They were infrastructure investments.
Once the trust layer was solid, revenue expansion became straightforward. Conversion Rate Lift reached 47%. Not because we changed the take rate, but because the platform was now delivering what participants came for.
The lesson I took from this: the revenue problem was a trust problem. The trust problem was a data quality problem. You can’t fix Layer 3 without diagnosing Layers 1 and 2 first.
| Why do marketplace platforms stall after initial traction? Most marketplace platforms stall because they optimize the wrong layer. They treat flat revenue yield as a monetization problem when it’s actually a trust or match rate problem. Supply grows, but matches don’t form reliably. Conversion stays low because participants don’t trust the platform enough to transact. Take rate expansion on top of an unstable trust layer removes the last reason for participants to absorb uncertainty – and conversion collapses. |
The Constraint Is Usually Match Quality, Not Supply Volume
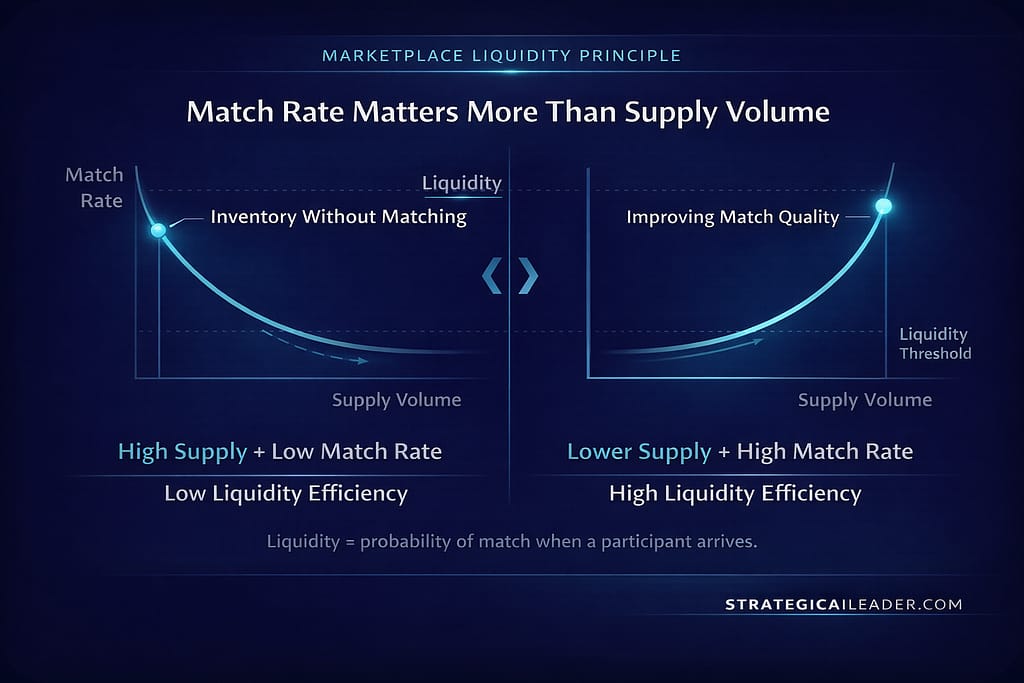
Higher match quality produces stronger liquidity even with fewer listings.
Most marketplace growth advice treats supply acquisition as the primary lever. Build enough supply, and demand will follow. That’s partially true in the earliest stages. It breaks down once the platform has crossed initial viability.
After the early stage, the real constraint is almost always match quality. A marketplace with 10,000 listings and a 40% match rate faces a fundamentally different problem than one with 2,000 listings and an 80% match rate. The second platform is closer to commercial viability, even with a smaller supply base.
This distinction matters because it changes where you invest. The foundational economics is well documented: Rochet and Tirole’s work on two-sided platform competition established that pricing on one side of a marketplace affects behavior on the other in ways that single-sided markets do not. NFX Guild’s research on network effects reinforces the point from a growth lens — platforms that attempt to build network effects before achieving reliable matching consistently underperform platforms that sequence liquidity first. Operators optimizing for supply volume after initial traction is established are solving the wrong problem.
Trust architecture improvements precede sustainable take rate expansion. Operators who understand this sequence build faster than those who bolt trust systems on after churn starts. The sequencing is the strategy.
The Pattern Holds Beyond MyEListing
The Marketplace Growth Operating Model isn’t specific to real estate. The same sequencing logic appears in platforms that got it right at scale.
Airbnb’s early trust architecture is the clearest example of Layer 2 investment made before it was urgently needed. The team introduced host verification, guest reviews, and the Host Guarantee program while the platform was still in early growth. They didn’t wait for a trust crisis to force the investment. The result was a trust infrastructure that could absorb rapid supply growth without degrading participant confidence. Platforms that bolt trust on after a high-profile incident spend months rebuilding signal that could have been built in days during quieter growth phases.
eBay’s reputation layer is the foundational case for why trust architecture is structural, not cosmetic. The feedback and seller rating system wasn’t a feature. It was the mechanism that made anonymous transactions between strangers commercially viable at scale. Without it, supply growth would have produced fraud growth, not revenue growth. eBay built the trust layer deliberately, and that decision determined whether the liquidity they were acquiring would convert to durable revenue or churn.
The counterexample is instructive too. Platforms that grow supply aggressively before the trust layer is ready tend to produce the same outcome: high GMV, flat revenue yield, rising churn on one side, and a trust infrastructure rebuild that costs significantly more than it would have cost to build correctly the first time.
The sequence isn’t a theory. It’s what the data from scaled platforms actually shows.
What Breaks When the Sequence Is Wrong
Take rate expansion before liquidity threshold. This is the most common failure. The platform has growing transaction volume, decides it’s ready to capture more revenue per transaction, and expands the take rate. Match rate drops because participants on the supply side recalibrate their assessment of whether the platform’s economics make sense for them. Liquidity collapses on one side. The platform interprets this as a sensitivity to supply. It’s actually a sequencing violation.
Trust investment before the liquidity threshold. This is less common but equally damaging. The platform invests heavily in verification, review systems, and trust infrastructure before reliable matching exists. The trust systems work fine technically. But participants who can’t reliably find a match don’t stay on the platform long enough to develop trust. The investment won’t yield returns until the liquidity problem is resolved.
Revenue expansion without trust architecture. This is the MyEListing starting condition. GMV was growing. Trust Signal was at 65%. Take rate expansion on top of a 65% trust signal doesn’t produce revenue growth. It produces churn. Participants leave rather than transact on a platform they’re not confident in.
I rebuilt the monitoring architecture after this. Every major platform decision now maps to a layer. Before any revenue optimization runs, the team verifies trust signal is above the threshold. Before trust investment scales, the team verifies match rate is above the threshold. The framework became the operating gate.
| When is the right time to expand the take rate on a marketplace? Take rate expansion becomes viable after the platform has crossed two thresholds: reliable match rate (sufficient supply-demand balance that participants expect to find a match when they show up) and a strong trust signal (participants believe the platform will protect them in a transaction). Expanding the take rate before both thresholds are crossed consistently reduces conversion and can collapse one side of the marketplace by making the economics unattractive relative to the platform’s demonstrated reliability. |
Operator Checklist: Diagnosing Your Layer
Use these signals to identify which layer is blocking your marketplace growth.
| Layer | Threshold | Meaning |
| Layer 1 – Liquidity | Match rate > 70% | Participants can reliably expect a match. Platform is ready for trust investment. |
| Layer 2 – Trust | Trust signal > 80% | Participants believe the platform protects them. Platform is ready for revenue expansion. |
| Layer 3 – Revenue | Both Layer 1 and 2 thresholds met | Take rate expansion and value-added services compound. Revenue yield tracks GMV. |
Layer 1 Check – Liquidity
- Is the match rate above 70%? If not, this is a pre-liquidity platform.
- Are participants returning to the platform after their first match?
- Is the supply-demand balance maintained across your primary categories?
- Are there meaningful listings on both sides of the market without promotional pressure?
Layer 2 Check – Trust
- What is your platform’s internal trust signal, and how is it measured?
- Do participants complete transactions without contacting support to verify legitimacy?
- Is your review infrastructure producing actionable signal or noise?
- Does your dispute resolution process meet participants’ expectations?
- Has the trust signal remained stable during platform growth, or has it degraded as volume has increased?

Layer 3 Check – Revenue
- Is the current take rate above, at, or below market comparables?
- Are value-added services generating attachment rates above 10%?
- Is the conversion rate stable or improving over the last 90 days?
- Does revenue yield per transaction track GMV, or is the gap widening?
Quick Wins by Layer
These are actions executable within one week for each layer.
Layer 1: Audit your match rate by category. Identify the lowest-performing category and conduct a manual match-quality review. If the problem is data quality, fix listing accuracy before adding supply.
Layer 2: Measure your trust signal directly. Run a post-transaction survey with one question: how confident were you that this platform would protect you in this transaction? A score below 75% signals a trust architecture problem, not a volume problem.
Layer 3: Map your current take rate against the trust signal score and match rate. If the trust signal is below 80% or the match rate is below 65%, delay any take rate expansion until both metrics improve. Review your LTV and CAC optimization alongside take rate — expanding revenue per transaction only makes sense when retention economics can absorb the additional platform cost. The revenue is there — but only after the platform has earned it.
The Sequence Is the Strategy
Marketplace growth isn’t a single problem. It’s three sequential problems with a strict order dependency.
Liquidity architecture comes first because nothing else works without reliable matching. Trust systems come second because conversion doesn’t scale without participant confidence. Revenue expansion comes third because yield only compounds on a platform that has earned the right to charge for its value.
Operators who try to shortcut the sequence don’t save time. They create rework. They invest in trust infrastructure that can’t land because matching is broken. They expand take rate on platforms that aren’t ready for it and watch conversion collapse. They chase GMV while revenue yield quietly disappears.
The platforms that build durable marketplace revenue follow the sequence deliberately. They measure the layer they’re actually in, not the layer they want to be in. They solve the real constraint before moving to the next one.
Most marketplace revenue problems are sequencing errors, not pricing errors. The take rate isn’t the constraint. The layer below it is.
The Marketplace Growth Operating Model is the framework for making that sequence visible and actionable. Where is your platform right now? Which layer is your actual constraint?
If you’re working through marketplace growth decisions inside a real platform and want to see how this framework applies to your specific layer constraints, join the StrategicAILeader subscriber list. Each issue covers the operating decisions that don’t make it into most growth strategy writing.
Want the frameworks before the articles are published? Subscribe to StrategicAILeader. Operators building real systems get the model before the post. Connect with me on LinkedIn or Substack for conversations, resources, and real-world examples that help.
Explore the Strategy Library
This article is part of a broader operator framework library covering AI execution, growth systems, and revenue infrastructure.
- Case Studies
Applied AI product launches, evaluation frameworks, and deployment decisions. - AI Strategy
Model selection, guardrails, automation architecture, and enterprise AI readiness. - AI + MarTech Automation
Workflow automation across acquisition, attribution, and lifecycle systems. - Growth Strategy
Compounding revenue systems across positioning, channels, retention, and expansion. - Revenue Operations
Pipeline architecture, forecasting reliability, and GTM infrastructure. - Sales Strategy
Deal velocity, qualification frameworks, and enterprise conversion mechanics. - SEO & Digital Marketing
Search-driven growth, authority building, and technical visibility systems. - COO Ops & Systems
Execution infrastructure, process scaling, and operating cadence design. - Leadership & Team Building
Organizational alignment, hiring systems, and operator capability development. - Strategic Thinking
Decision frameworks for complex product, platform, and market environments. - Framework Visuals
Operator diagrams, system stacks, and execution maps. - Personal Journey
Lessons from building platforms, shipping AI products, and leading execution teams.
Want 1:1 strategic support?
Connect with me on LinkedIn
Read my playbooks on Substack


