

The Ultimate Guide to Customer and Revenue Churn
A company reports 2% churn. What Is Churn appears manageable as a metric, and leadership moves to the next slide.
Understanding What Is Churn shows that hidden details matter more. One enterprise account produced most of the lost revenue. Three other customers left during onboarding. Another group disappeared after failed payments. Each loss points to a different problem, yet the dashboard compresses them into a single percentage.
That is the limitation of churn reporting. The metric tells you how much customer loss occurred. The operating work begins when you determine where the loss came from, what the loss costs, who owns the response, and whether the response deserves more investment.
Strong churn management follows three stages: Measure, Diagnose, Act.
Most companies measure. Fewer diagnose. The gap between diagnosis and action is where expensive customer problems survive another quarter.
What Is Churn?
| Churn is the loss of customers, subscribers, or recurring revenue during a defined period. Companies usually express churn as a percentage so leaders track how customer loss changes across months, quarters, cohorts, products, or customer segments. |
Stripe defines churn rate as the percentage of customers or subscribers who end their relationship with a company during a specified period. Customer churn measures relationships lost. Revenue churn measures the financial impact of those losses.
That distinction matters. A churn rate is a measurement, not a diagnosis.
Two companies might each report 3% customer churn while facing completely different problems. One might lose low-value customers acquired through an unprofitable channel. The other might lose two strategic accounts representing a significant share of recurring revenue. The percentage looks similar. The operating decision should not.
Churn becomes useful when leadership moves beyond the company average and identifies the losses creating the number.
How Do You Calculate Customer Churn?
The basic customer churn formula is straightforward:
Customer churn rate = Customers lost during the period ÷ Customers at the start of the period × 100
If a company begins the month with 1,000 customers and loses 20, monthly customer churn equals 2%.
Stripe uses the same basic churn formula and recommends defining the measurement period before comparing results. Monthly, quarterly, and annual churn answer different questions, especially when contract lengths and buying cycles differ.
The simplicity of the formula sometimes creates false confidence. Knowing the rate does not tell leadership which customers left, how valuable they were, why they left, or whether the losses cluster around the same operating problem.
The calculation provides the signal. Diagnosis gives the signal meaning.
What Is Revenue Churn?

how much recurring revenue leaves with them
Revenue churn measures recurring revenue lost from existing customers through cancellations, downgrades, and similar reductions.
A common gross revenue churn calculation is:
Gross revenue churn rate = Recurring revenue lost during the period ÷ Recurring revenue at the start of the period × 100
Suppose a SaaS company starts the month with $250,000 in monthly recurring revenue and loses $18,000 through cancellations and downgrades. Gross revenue churn equals 7.2%.
Net revenue churn goes one step further by accounting for expansion revenue from existing customers. Upsells, upgrades, and cross-sells offset some of the revenue lost through churn and contraction. Paddle explains revenue churn, including the distinction between customer churn and revenue churn.
The distinction changes how leaders interpret performance. Customer count tells you how many relationships disappeared. Revenue churn tells you how much economic value left with them.
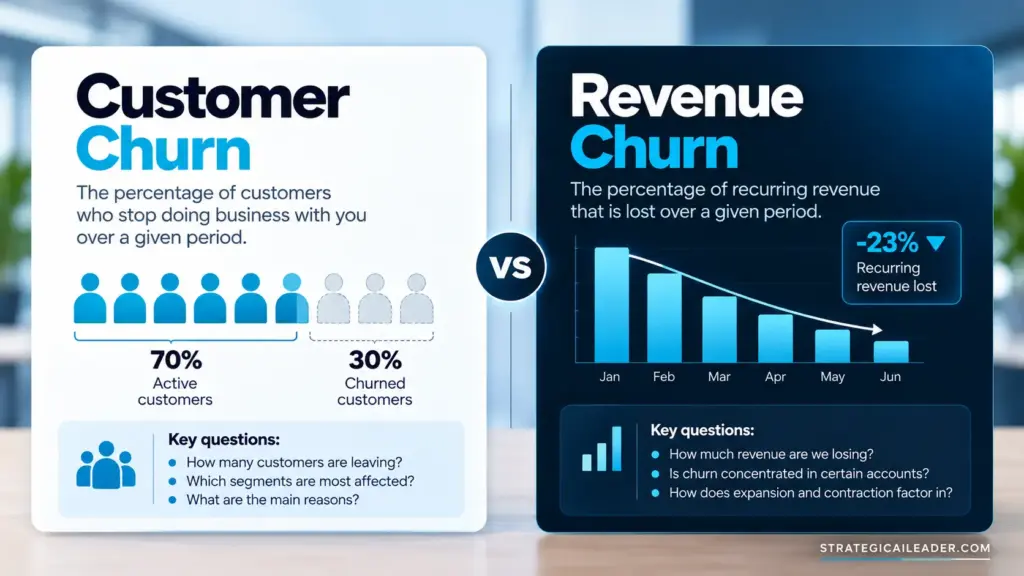
A company losing 2% of customers and 7.2% of recurring revenue does not have a 2% problem. The revenue concentration tells a different story.
Why Churn Matters More Than the Dashboard Suggests
Every lost customer creates revenue the company must replace before new acquisition produces net growth.
Consider a company adding $100,000 in new recurring revenue during the quarter while losing $80,000 from existing customers. Sales celebrates $100,000 in new business. The company produced only $20,000 from those two flows before accounting for other revenue changes.
Acquisition activity looks strong while churn absorbs most of the gain.
The economics become more significant when customer replacement costs enter the picture. Harvard Business Review reports research estimating that acquiring a new customer costs five to 25 times more than retaining an existing customer, depending on the industry and study. The same article cites Bain research associating a 5% increase in customer retention with profit increases ranging from 25% to 95%.
Those figures should not serve as universal forecasts, but they explain why retention and churn deserve executive attention.
The deeper issue is resource allocation.
If leadership does not know where churn originates, teams spend money treating symptoms. Marketing acquires replacement customers. Sales adds pipeline. Customer Success launches another retention program. Product adds features. Finance watches recurring revenue move.
Everyone works. Nobody has proved which loss deserves intervention.
That is why churn belongs inside an operating system, not only inside a dashboard.
The Measure, Diagnose, Act Churn System
A useful churn system moves through three stages. Each stage answers a different executive question.

1. Measure the Loss
Measurement establishes what happened. Track customer churn and revenue churn over a consistent period, then segment the results in ways that match the business model.
A company might examine churn by customer size, contract value, tenure, acquisition source, product, pricing tier, industry, onboarding path, account owner, or cancellation reason. The right dimensions depend on where meaningful operating differences exist.
The goal is not to create more charts. The goal is to find concentration.
Company averages often hide concentration because every loss receives equal visual weight inside the percentage. Ten small account cancellations and one major enterprise cancellation might produce the same customer count while creating different financial consequences.
Measure both the number of customers lost and the recurring revenue attached to those losses.
2. Diagnose the Loss
Diagnosis moves from “our churn increased” to “these customers left under these conditions.”
Start with the customers or revenue units creating the largest or most unusual losses. Look for shared characteristics. Examine when they left, what happened before cancellation, which product or service they used, how they entered the company, and which operating experience they shared.
Specificity changes the quality of the discussion.
“Enterprise churn increased” gives leadership little direction.
“Three first-year enterprise customers canceled within 60 days of incomplete onboarding, representing 42% of lost MRR for the quarter” gives the organization something to investigate.
Diagnosis should also separate different causes. Payment failure, weak onboarding, poor qualification, pricing resistance, service breakdowns, product gaps, and competitive displacement do not belong inside the same intervention.
A single churn percentage compresses those causes. Operators separate them.
3. Act on the Evidence
Once leadership identifies a meaningful churn pattern, one person should own the response.
The owner does not need to perform every task. Product might address a product gap. Finance might fix billing friction. Customer Success might redesign onboarding. Sales might change qualification criteria. Marketing might stop acquiring customers from a source producing weak retention.
Cross-functional participation helps. Accountability still needs a name.
The owner should record the problem, intervention, expected result, evidence, review period, and decision rule. At the next review, leadership should decide whether to continue the intervention, change it, expand it, or stop funding it.
I call this the keep-or-kill decision. The phrase refers to the intervention or operating motion, not the customer.
Without a decision rule, churn work turns into permanent activity. Teams keep programs alive because nobody established the evidence required to stop them.
A Churn Example: When 2% Hides the Real Problem
Consider a SaaS company entering January with 1,000 customers and $250,000 in monthly recurring revenue.
Twenty customers cancel.
Customer churn equals 2%.
Those customers represented $18,000 in monthly recurring revenue, producing 7.2% gross revenue churn.
A company-level dashboard might stop there. The operating review should continue.
Leadership examines the lost accounts and finds one enterprise customer responsible for $12,000 of the $18,000 in lost MRR. One account therefore produced two-thirds of the revenue loss.
The team reviews the account history. Implementation ran behind schedule. Product adoption stayed low. Key users never completed onboarding. The customer canceled before the first renewal.
Now leadership has something different from a churn percentage.
The 2% metric measured the outcome. Revenue analysis exposed the concentration. Account evidence identified a likely operating problem.
The company then reviews other enterprise accounts from the same onboarding cohort. Several show similar adoption patterns. One owner receives responsibility for the intervention. The team changes the onboarding process, defines the accounts in scope, identifies adoption evidence, and schedules a review.
The next leadership discussion is no longer:
“How do we reduce churn?”
The question becomes:
“Did the revised onboarding motion reduce early enterprise losses enough to keep funding this intervention?”
That is an operating decision.
Churn vs Retention, NRR, LTV, CAC, and Unit Economics
Churn sits beside several metrics that describe related parts of customer economics. They should not become interchangeable.
| Concept | Primary Question |
|---|---|
| Customer churn | How many customers did we lose? |
| Revenue churn | How much recurring revenue did we lose? |
| Retention | How much of the existing customer base did we keep? |
| Net revenue retention | How did recurring revenue from existing customers change after churn, contraction, and expansion? |
| Customer lifetime value | What economic value do we expect from a customer relationship? |
| Customer acquisition cost | What does acquiring a customer cost? |
| Unit economics | Does one customer, transaction, or unit create acceptable economics? |
Retention and churn describe related sides of customer movement. Retention focuses on customers who remain. Churn focuses on customers who leave.
Executives need those distinctions because the same churn event affects several parts of the business. A lost customer reduces recurring revenue. The loss affects expected lifetime value. Replacing the customer requires acquisition spending. If losses concentrate in a specific segment, the economics of serving or acquiring that segment deserve another look.
If churn exposes weak customer economics, read How to Improve LTV and CAC: Proven Profit Guide to connect lifetime value, acquisition cost, and profitability with operating decisions.
The metrics connect. The decisions remain different.
What Leaders Get Wrong About Churn
Treating Reporting as Management
A dashboard percentage proves the company calculated churn. It does not prove anyone diagnosed the loss or acted on the evidence.
Treating Every Lost Customer as Equal
Customer count without revenue context often sends teams toward the wrong problem. A small number of high-value accounts might matter more than a large number of low-value cancellations.
Assigning Churn to One Department
Customer Success often plays a major role, but churn originates across the customer system. Poor qualification begins before the sale. Weak onboarding appears after it. Product gaps surface during use. Billing failures occur around payment. Pricing problems emerge at purchase and renewal.
Departments describe organizational boundaries. Customers experience the full system.
Launching Retention Programs Before Diagnosing the Loss
Broad retention programs feel productive because teams start working immediately. The problem is measurement. If leadership does not know which churn pattern the program addresses, the intervention has no clean test.
Diagnosis should come before intervention. Identify the customers, economic impact, shared conditions, and likely cause before assigning resources.
Letting Churn Initiatives Survive Without Evidence
A churn initiative should earn continued investment through observable results, not activity reports.
If an onboarding change targets first-year enterprise churn, leadership should know which accounts sit inside the test, what evidence defines improvement, when the review occurs, and what result changes the funding decision.
The work should end, change, or expand based on evidence.
How Churn Fits Into Growth Strategy
Churn does not sit outside growth. Retention is one part of the growth system.
A company with strong acquisition and weak retention keeps replacing revenue instead of compounding it. Increasing acquisition spend before understanding churn often hides the underlying problem for another quarter.
This is why churn should connect directly to the broader growth architecture. In What Is Growth Strategy? The System Behind Scalable Revenue, I break growth into a system spanning signal, acquisition, conversion, retention, and expansion.
Churn gives leadership one of the clearest signals inside the retention layer. The next question is whether the organization knows why the loss occurred and what response deserves funding.
How to Review Churn This Week
Start with the most recent churn period and work through one operating review:
- Calculate customer churn.
- Calculate revenue churn.
- Identify the customers responsible for the largest revenue losses.
- Group those losses by segment, tenure, onboarding path, product, acquisition source, or cancellation reason.
- Select one churn pattern worth investigating.
- Quantify the economic impact.
- Assign one accountable owner.
- Define the intervention.
- Define the evidence the team will review.
- Set the review date.
- Decide whether the intervention continues, changes, expands, or stops.
The objective is not a better-looking churn dashboard.
The objective is a better decision.
Churn FAQ
What is churn?
Churn is the loss of customers, subscribers, or recurring revenue during a defined period. Customer churn measures relationships lost. Revenue churn measures the economic value lost through cancellations, downgrades, and similar reductions. Stripe provides a standard churn definition and calculation.
How do you calculate churn?
Divide the number of customers lost during a period by the number of customers at the beginning of the period, then multiply by 100. A company beginning the month with 1,000 customers and losing 20 has 2% customer churn.
What is revenue churn?
Revenue churn measures recurring revenue lost from existing customers. Gross revenue churn measures lost recurring revenue without offsetting expansion. Net revenue churn incorporates expansion revenue from the existing customer base. Paddle provides a deeper explanation of revenue churn.
What is the difference between customer churn and revenue churn?
Customer churn counts customers lost. Revenue churn measures the financial impact. A company might report low customer churn while experiencing high revenue churn if several high-value accounts leave.
Is churn the same as retention?
No. Churn measures customers who leave during a period. Retention measures customers who remain. They describe related sides of customer movement.
Who should own churn?
No single department owns every cause of churn. Each active churn problem should still have one accountable owner responsible for coordinating the response, maintaining evidence, and bringing the decision back to leadership.
From Churn Metric to Operating Decision
Most companies know how to calculate churn.
The harder question is whether the organization knows what to do with the number.
Measure the loss. Diagnose where the loss concentrates and what conditions surround it. Assign ownership. Test an intervention against observable evidence. Then decide whether the work deserves continued investment.
Measure. Diagnose. Act.
A churn percentage tells you what left.
An operating system tells you what to do next.
Continue Learning
If churn exposes weak customer economics, read How to Improve LTV and CAC: Proven Profit Guide to connect customer loss with acquisition cost, lifetime value, and profitability.
If the problem reaches beyond retention into how your company sequences growth decisions, read What Is Growth Strategy? The System Behind Scalable Revenue.
Subscribe to the Strategic AI Leader newsletter for practical frameworks covering AI, operations, leadership, and growth. Each article focuses on systems leaders use to turn metrics into better operating decisions.
Explore the Strategy Library
This article is part of a broader operator framework library covering AI execution, growth systems, and revenue infrastructure.
- Case Studies
Applied AI product launches, evaluation frameworks, and deployment decisions. - AI Strategy
Model selection, guardrails, automation architecture, and enterprise AI readiness. - AI + MarTech Automation
Workflow automation across acquisition, attribution, and lifecycle systems. - Growth Strategy
Compounding revenue systems across positioning, channels, retention, and expansion. - Revenue Operations
Pipeline architecture, forecasting reliability, and GTM infrastructure. - Sales Strategy
Deal velocity, qualification frameworks, and enterprise conversion mechanics. - SEO & Digital Marketing
Search-driven growth, authority building, and technical visibility systems. - COO Ops & Systems
Execution infrastructure, process scaling, and operating cadence design. - Leadership & Team Building
Organizational alignment, hiring systems, and operator capability development. - Strategic Thinking
Decision frameworks for complex product, platform, and market environments. - Framework Visuals
Operator diagrams, system stacks, and execution maps. - Personal Journey
Lessons from building platforms, shipping AI products, and leading execution teams.
Want 1:1 strategic support?
Connect with me on LinkedIn
Read my playbooks on Substack