The Ultimate B2B Efficiency Metrics Playbook for Leaders
Editor’s Note: This article is part of a two-part B2B metrics series on StrategicAILeader.com. In Part 1, we focus on revenue metrics every leader must track to align growth with performance. In Part 2, we break down efficiency metrics that help leaders scale smarter without wasted spend. Both guides are designed to provide you with practical frameworks and clear examples that you can put into action today.
Part 2: Table of Contents:
- Executive Summary
- Gross Margin: The Scalability Backbone
- Burn Multiple: Efficiency of Growth Spend
- Rule of 40: Balancing Growth and Profit
- Sales Efficiency Ratios: Quality of Growth
- SaaS Quick Ratio
- Revenue per Employee: Operational Leverage
- Employee Engagement & Turnover: Cultural Health
- Quota Attainment Rates: Ground Truth for Sales
- Making Metrics Actionable: Beyond the Dashboard
- Closing Perspective: Building Businesses That Endure
- FAQs for The B2B Efficiency, Profitability & Team Metrics Playbook for Leaders
Executive Summary
The B2B Efficiency, Profitability & Team Metrics Playbook for Leaders
Why this matters: Revenue growth is only the first chapter. An accurate scale depends on efficient growth economics and strong people systems. This playbook outlines the essential metrics to help Leaders build a lasting business.
Key metrics covered:
- Gross Margin: Your foundational scalability signal
- Burn Multiple: Cash efficiency in growth phases
- Rule of 40: Balance growth and profitability
- Sales Efficiency Ratios: Magic number and SaaS quick ratio insights
- Revenue per Employee: Operational leverage checkpoint
- Employee Metrics: Engagement, turnover, and quota attainment
What you’ll gain:
- Clear formulas and benchmarks
- Common pitfalls and operational stories
- Frameworks to make metrics actionable and align the entire organization
Bottom line:
Efficiency and team health metrics transform growth from risky expansion into resilient, lasting scale.
In Part 1 of this series (The Ultimate B2B Revenue Metrics Guide for Leaders), I covered the core revenue and growth metrics that form the heartbeat of a B2B business. But Revenue is only half the story. Sustainable scale depends just as much on operational efficiency, profitability, and the health of your people and systems.
After 25 years leading SEO strategy, including growing Realtor.com from $75 million to over $500 million in Revenue with SEO driving 74% of all leads and Revenue, and nearly three years as a CMO and COO, I learned the hard way that top-line growth without operational discipline is a dangerous illusion.
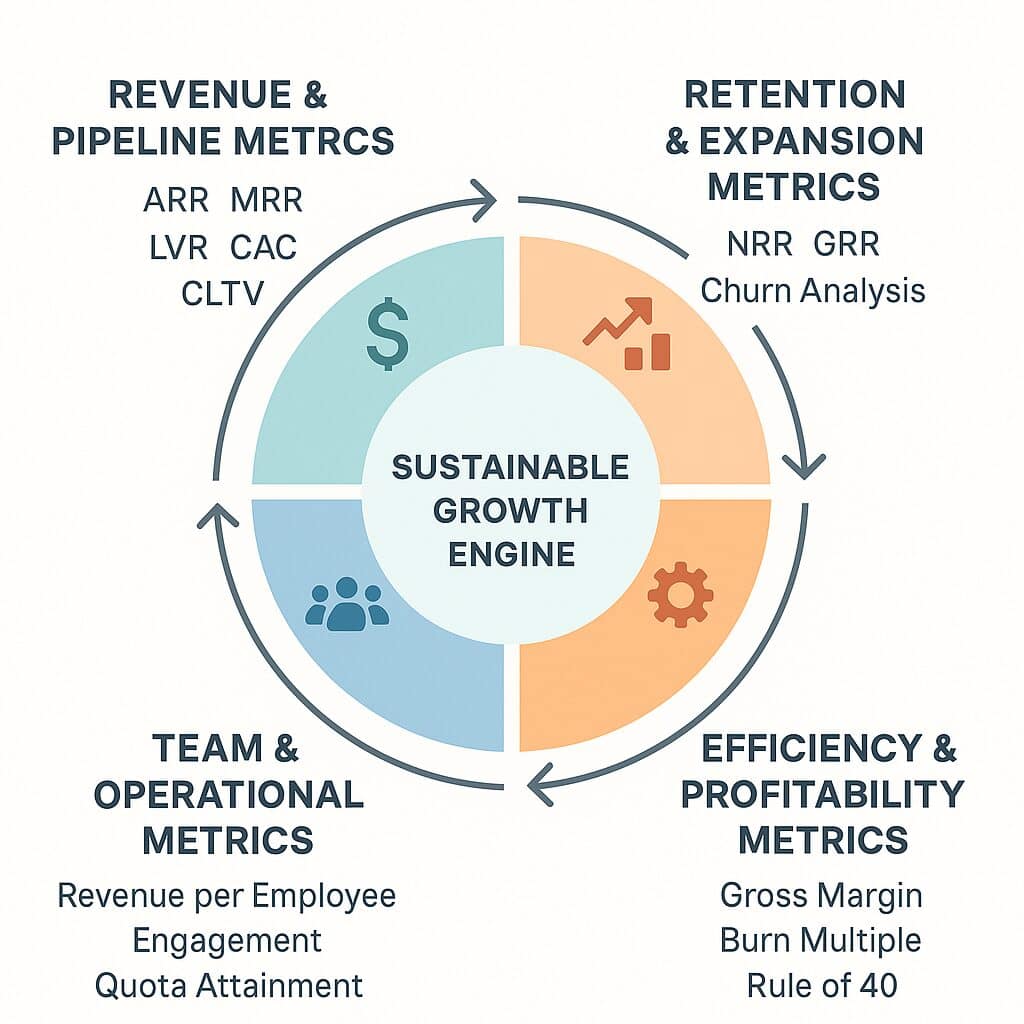
In Part 2, we break down the B2B efficiency and profitability metrics, along with team and operational metrics that indicate whether your business can scale, not just grow (e.g., Bottom half of the Growth Engine).
Gross Margin: The Scalability Backbone
Gross margin shows how much Revenue you keep after covering the direct costs of delivering your service.
Formula:
(Revenue – Cost of Goods Sold) ÷ Revenue
Benchmarks:
- B2B SaaS: typically above 75%
- Service-heavy businesses: around 60–70%
What to watch for:
- Including costs that should be above the gross margin (such as R&D or sales) can distort this metric.
- Rising support or infrastructure costs often signal potential margin compression in the future.
Strategic importance:
Gross margin is not just a number; it’s a powerful tool that determines how much you can reinvest in growth, R&D, and customer success. A company with 80% gross margins can allocate 40% of its Revenue to growth initiatives while remaining profitable. One at 60% has far less flexibility. As a Leader, understanding and leveraging this metric gives you the power to steer your business towards sustainable growth.
According to OpenView’s “2023 SaaS Benchmarks Report,” leading SaaS companies sustain gross margins above 75%, providing critical flexibility to reinvest in growth initiatives and maintain competitive differentiation.
Burn Multiple: Efficiency of Growth Spend
Burn multiple measures to determine how efficiently you translate cash burn into new ARR.
Formula:
Net cash burn ÷ Net new ARR in a given period
Benchmarks:
- Below 1.5: strong efficiency
- 1.5–2.0: acceptable if justified by growth speed
- Above 3: red flag for capital inefficiency
Operator story:
At a fintech startup, we realized our burn multiple had crept above three due to heavy spending on enterprise deals with long cycles. By tightening qualification criteria and optimizing marketing spend, we reduced it to 1.6, significantly extending our runway without sacrificing growth.
As David Sacks explains in Craft Ventures’ “Burn Multiple” framework, a burn multiple below 1.5 signals strong capital efficiency, while values above 3 indicate inefficient growth and potential cash runway risks.
Rule of 40: Balancing Growth and Profit
The Rule of 40 is a simple yet powerful metric: your revenue growth rate plus your profit margin should exceed 40%. This metric is particularly relevant to B2B businesses as it forces a balance between aggressive growth and operational sustainability. In uncertain markets, companies that consistently meet or exceed the Rule of 40 have far more strategic flexibility, making them more attractive to investors.
Example:
- 50% growth rate with a -10% margin → score of 40 (acceptable)
- 20% growth rate with a 25% margin → score of 45 (healthy)
Why it matters:
This metric forces a balance between aggressive growth and operational sustainability. In uncertain markets, companies with a history of over 40 years have far more strategic flexibility, making them more attractive to investors.
Strategic Application:
Use the Rule of 40 to guide decisions on when to prioritize growth investments versus efficiency improvements.
As Bain & Company highlights in “The Rule of 40 for SaaS: Balancing Growth and Profitability,” businesses exceeding the Rule of 40 tend to achieve stronger long-term valuation multiples and strategic optionality.
Sales Efficiency Ratios: Quality of Growth
Magic Number
Formula:
Quarterly net new ARR × 4 ÷ Prior quarter’s sales and marketing spend
Interpretation:
- Above 1.0: efficient spend driving growth
- Below 0.5: Growth is expensive and inefficient
Why it matters:
Tells you whether you’re generating enough incremental ARR to justify your go-to-market spend.
SaaS Quick Ratio
Formula:
(New MRR + Expansion MRR) ÷ (Churned MRR + Contraction MRR)
Interpretation:
- Above 4.0: very strong
- 2.0–4.0: healthy
- Below 1.0: signals more Revenue lost than gained
Operator tip: Quick ratios help highlight whether you’re relying too much on new sales to offset churn rather than driving expansion and stickiness.
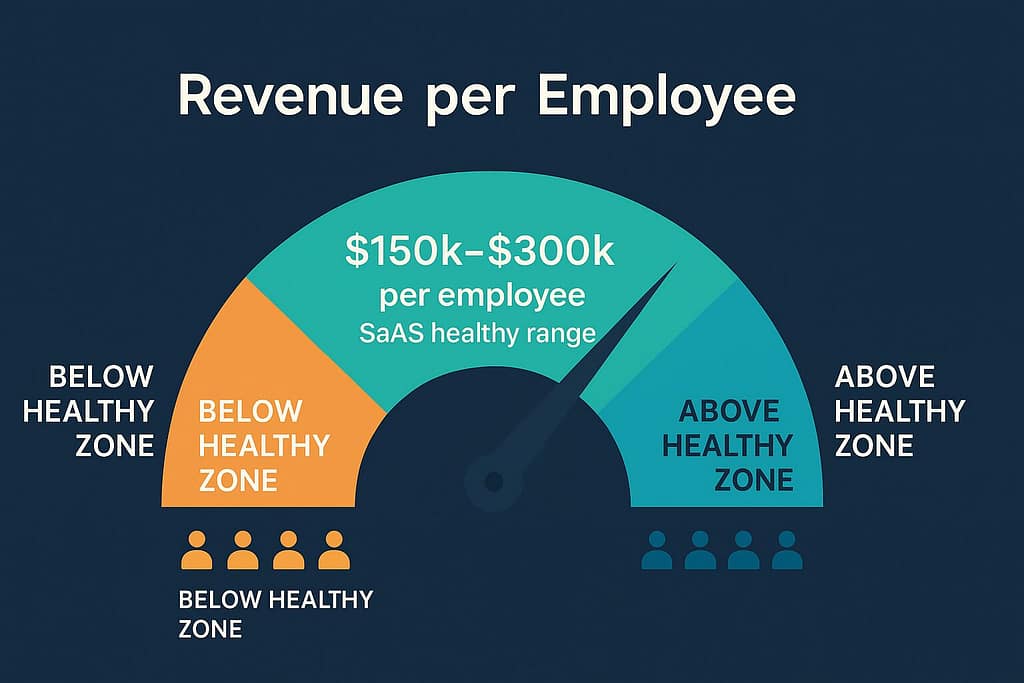
Revenue per Employee: Operational Leverage
The ‘Revenue per Employee’ metric shows your ability to scale Revenue relative to headcount growth. It is a key indicator of operational efficiency and team productivity. If this metric doesn’t improve over time, it signals inefficiencies in your organizational design or execution, which can hinder your business’s scalability and team health.
Formula:
Annual Revenue ÷ Total employees
Benchmarks:
- SaaS: $150,000 to $300,000 per employee
- Services: generally lower, depending on the model
Strategic insight:
You can expect the Revenue per employee to decline during the early, aggressive hiring phases. However, if it doesn’t improve over time, it signals inefficiencies in your organizational design or execution.
Use case:
Guide hiring decisions and capacity planning. If you’re below benchmarks, focus on productivity improvements before scaling headcount.
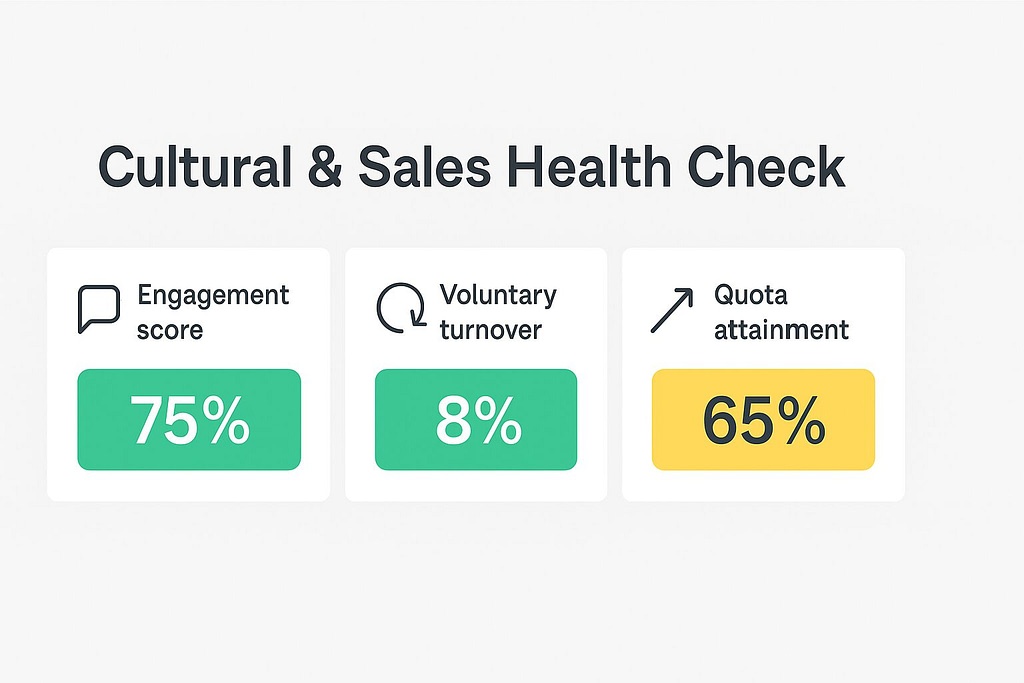
Employee Engagement & Turnover: Cultural Health
High voluntary turnover can hurt growth, erode institutional knowledge, and damage customer relationships.
Benchmarks:
- Below 10%: excellent
- 10–15%: healthy, depending on context
- Above 15%: red flag
Cost impact:
Replacing a sales rep can cost 6–12 months of productivity plus recruiting and training expenses.
Strategic implication:
Chronic high turnover often indicates cultural, leadership, or operational misalignment that will eventually be reflected in your customer metrics.
Quota Attainment Rates: Ground Truth for Sales
This metric measures what percentage of your sales team hits their quota.
Benchmarks:
- 60–80% of reps hitting quota: healthy
- Below 50%: signals misaligned quotas, poor enablement, or resource gaps
- If more than 90% of reps hit quota, you may have set quotas too low and left growth on the table
Operator story:
At a SaaS company I was consulting for, we once observed that only 45% of our inside sales representatives were hitting quota. After digging in, we realized our lead routing and scoring heavily favored certain territories, leaving other reps with lower-quality opportunities. We redesigned the lead distribution system, improved our qualification criteria, and invested in sales enablement. Within a year, quota attainment climbed to 72%, and overall team morale and retention improved significantly.
Making Metrics Actionable: Beyond the Dashboard
Metrics are only valuable when they drive decisions and behavior.
Narrative framework:
Metrics should tell a clear story. A rising CAC with a declining LTV indicates a crisis in efficiency. Growing MRR with a declining NRR suggests that acquisition success is masking retention problems.
Monthly business reviews:
Tie metrics to specific actions. If CAC payback extends from 9 to 14 months, what adjustments will you make to your channel strategy, pricing, or onboarding process?
Cultural alignment:
Embed metrics into daily workflows. When teams understand how their work affects gross margin or revenue retention, they naturally develop accountability and a shared focus.
Closing Perspective: Building Businesses That Endure
Top-line growth can be intoxicating. However, only businesses that strike a balance between growth and efficiency, as well as team health, will endure market cycles and competitive shocks.
Your role as a Leader is not just to drive growth, but to ensure that development is sustainable, efficient, and supported by a strong and aligned team. The right metrics provide a roadmap to do precisely that. As a leader, you’re more than just a guide. You play a crucial role in transforming these metrics into actionable strategies that drive the company forward.
What’s Next
If you’ve read both parts, you now have a comprehensive playbook:
Revenue, growth, efficiency, profitability, and people metrics, all translated into operational levers from abstract KPIs. This playbook serves as your guide, tool, and source of knowledge, equipping you with the information you need to make informed and strategic decisions for your business.
Your competitors are still flying blind. You don’t have to.
We’ve unpacked the key metrics and frameworks that help leaders move beyond surface-level growth into operational excellence and team health. However, metrics always raise more questions, such as implementation, edge cases, or what to prioritize next.
That’s why I’ve compiled an FAQ section to address the most common questions I hear from founders, COOs, and operational leaders as they begin applying these ideas. Let’s dive in.
FAQs for The B2B Efficiency, Profitability & Team Metrics Playbook for Leaders
What is the most critical metric for evaluating operational efficiency in a B2B business?
While it depends on your business model, Gross Margin is often considered the foundational metric for operational efficiency. It indicates how much revenue remains after covering direct costs, providing the fuel for reinvestment in growth and R&D.
How does the Burn Multiple help SaaS and B2B leaders manage cash flow?
The Burn Multiple measures how efficiently a company turns cash burn into new annual recurring revenue (ARR). A lower multiple (below 1.5) signals strong capital efficiency and a longer runway, allowing leaders to make more strategic growth investments.
Why is the Rule of 40 so important for B2B SaaS companies?
The Rule of 40 forces a balance between growth and profitability. By ensuring your revenue growth rate plus profit margin exceeds 40%, you maintain strategic flexibility and appeal to investors who value sustainable business models.
What benchmarks should I use for Revenue per Employee?
For SaaS businesses, typical benchmarks range from $150,000 to $300,000 per employee. If you’re below these thresholds, it may signal issues with productivity, operational inefficiency, or misaligned headcount growth.
How can Sales Efficiency Ratios improve the go-to-market strategy?
Metrics like the Magic Number and SaaS Quick Ratio indicate whether your sales and marketing expenditures effectively drive growth. They help you understand if your acquisition model is sustainable or needs recalibration.
What does Quota Attainment reveal about sales team health?
Quota Attainment Rates indicate how effectively your sales team is meeting its targets. If fewer than 50% of the team hits the quota, it may indicate misaligned territories, poor enablement, or unrealistic targets. It’s a critical ground-truth measure of sales effectiveness.
How can leaders make these metrics actionable rather than purely reporting numbers?
Leaders should embed metrics into decision-making frameworks, tie them to monthly business reviews, and align them with cultural goals. Metrics must drive behavior, not just sit in dashboards.
How do engagement and turnover metrics affect business scalability?
High employee engagement and low turnover protect institutional knowledge, reduce hiring costs, and enhance the overall customer experience. Chronic high turnover often indicates deeper cultural or operational issues that can hinder growth.
Are these metrics only relevant to SaaS companies?
No. While SaaS benchmarks are commonly referenced, these metrics—such as gross margin, burn rate, and revenue per employee—apply broadly to B2B companies across technology, professional services, and even hybrid business models.
What’s the most significant risk of focusing only on revenue growth?
Focusing solely on revenue can mask inefficiencies and operational risks, creating a fragile business model. Without attention to efficiency, profitability, and team health, growth becomes unsustainable, exposing the business to market shocks.
Related Articles
The Ultimate B2B Revenue Metrics Guide for Leaders – (Part 1 Metrics Guide)
How to Create a Winning Data-Driven Sales Strategy
Proven B2B Outreach Strategy That Gets Real Results
B2B Metric Frameworks Infographics: Unlock Growth & Profits Now
About the Author
I write about: