Editor’s Note: This article is part of a 2-part B2C metrics series on StrategicAILeader.com. In Part 1, we focus on growth metrics that drive revenue acceleration and customer acquisition. In Part 2, we break down brand health metrics that indicate long-term strength and market positioning. Together, these guides provide leaders with a comprehensive view of how to scale revenue today while safeguarding brand equity for tomorrow.
Part 2: Table of Contents:
- Executive Summary
- Metric Interdependencies: Understanding the Connected System
- PART 2: Efficiency, Engagement & Brand Health Metrics
- 1. Marketing Efficiency Ratio (MER / ROAS)
- Key Benefits of MER as a Brand Health Metric:
- 2. Channel Attribution & Media Mix
- 3. Email & SMS Metrics
- 4. Referral & Word-of-Mouth Impact
- 5. Customer Satisfaction & NPS
- 6. Return Rate & Refunds
- 7. Inventory Turnover & Stockouts
- 8. Loyalty Program Participation
- 9. Brand Search Volume & Share of Voice
- 10. Social Engagement & Creator ROI
- BONUS SECTION: AI-Enhanced B2C Brand Health Metrics
- Frequently Asked Questions About B2C Brand Health Metrics
- Related Articles
Executive Summary
B2C brand health metrics offer crucial insights beyond revenue numbers, enabling businesses to foster sustainable growth through enhanced customer engagement, loyalty, and operational efficiency. While revenue remains important, successful B2C brands understand that monitoring comprehensive brand health metrics creates a competitive advantage in today’s market.
In Part 1, we examined the key B2C growth metrics that enable you to understand acquisition performance, efficiency, and revenue expansion. Part 2 builds on that foundation, focusing on brand health—the deeper signals that reveal the strength and resilience of your customer relationships.
This guide explores ten essential B2C brand health metrics that every consumer brand should track:
- Marketing Efficiency Ratio (MER/ROAS) – True blended performance measurement
- Channel Attribution & Media Mix – Incrementality vs attribution bias
- Email & SMS Metrics – Engagement quality and revenue impact
- Referral & Word-of-Mouth Impact – Organic growth measurement
- Customer Satisfaction & NPS – Loyalty and retention indicators
- Return Rate & Refunds – Product quality and expectation alignment
- Inventory Turnover & Stockouts – Operational efficiency impact
- Loyalty Program Participation – Repeat purchase drivers
- Brand Search Volume & Share of Voice – Market position assessment
- Social Engagement & Creator ROI – Community building effectiveness
These metrics enable brands to identify growth opportunities, optimize customer acquisition costs, reduce churn, and foster lasting customer relationships that drive long-term profitability. Modern B2C brands face increasing customer acquisition costs, shorter attention spans, and intense competition. Success requires understanding how customers interact with your brand across every touchpoint—from initial awareness through post-purchase advocacy.
The B2C brand health metrics outlined here provide the foundation for data-driven decisions that create sustainable competitive advantages.
Metric Interdependencies: Understanding the Connected System
B2C brand health metrics don’t operate in isolation – they form an interconnected system where improvements in one area often amplify performance across others. Understanding these relationships enables strategic decision-making that creates compounding growth effects.
Key Metric Relationships
Marketing Efficiency Ratio (MER) ↔ Customer Lifetime Value (LTV) Improving MER from 3:1 to 5:1 typically increases cash runway by 40-60% at current spend levels, while higher-quality traffic often correlates with 15-25% higher LTV.
Customer Satisfaction (NPS) ↔ Multiple Metrics
- Returns: A 10-point NPS increase typically reduces return rates by 2-4%
- Referrals: Promoters (NPS 9-10) generate 3x more referrals than passives (NPS 7-8)
- Social Engagement: Satisfied customers create 5x more positive UGC
Email Engagement ↔ Loyalty Program Participation Active email subscribers show 40-60% higher loyalty program engagement, while loyalty members demonstrate 25-35% higher email engagement rates.
Inventory Health ↔ Customer Satisfaction Stockout rates above 15% typically correlate with 10-20 point NPS decreases, while optimal inventory turnover (8-12x annually) supports 15-25% higher customer satisfaction.
Brand Search Volume ↔ Social Engagement: Strong social engagement drives a 20-40% increase in branded search volume, while higher brand search volume correlates with a 2-3x higher social media reach.
Strategic Implications
When optimizing metrics, consider cascading effects: improving customer satisfaction simultaneously enhances referral rates, reduces return costs, and increases social engagement. This systems thinking approach maximizes ROI from metric improvement initiatives.
A Note on Over-Optimization
While optimizing metrics drives operational and financial gains, there’s a risk in focusing too heavily on short-term efficiency at the expense of long-term brand equity. For example, aggressively cutting marketing spend to improve MER might erode brand awareness, or minimizing return rates might create friction that damages customer relationships. The most successful brands strike a balance between immediate performance and ongoing brand investment.
PART 2: Efficiency, Engagement & Brand Health Metrics
1. Marketing Efficiency Ratio (MER / ROAS)
Formula: Total Revenue ÷ Total Marketing Spend
Marketing Efficiency Ratio is one of the most critical B2C brand health metrics, providing an unbiased view of marketing performance across all channels. Unlike platform-specific ROAS reporting, MER eliminates attribution bias, providing brands with an accurate picture of marketing effectiveness.
Key Benefits of MER as a Brand Health Metric:
- True Blended ROAS: Combines performance across all marketing channels without double-counting conversions
- Budget Optimization: Identifies the most efficient marketing mix for sustainable growth
- Performance Benchmarking: Provides consistent measurement standards across different periods
Implementation Strategy: Calculate MER across multiple timeframes (7-day, 30-day, 90-day) to understand seasonal patterns and campaign impact. Most successful B2C brands target MER between 4:1 and 6:1, though this varies by industry and business model.
Optimization Tactics:
- Use MER trends to identify underperforming periods and investigate root causes.
- Allocate budget based on blended performance rather than platform-specific metrics.
- Set realistic ROAS targets that account for cross-channel attribution.
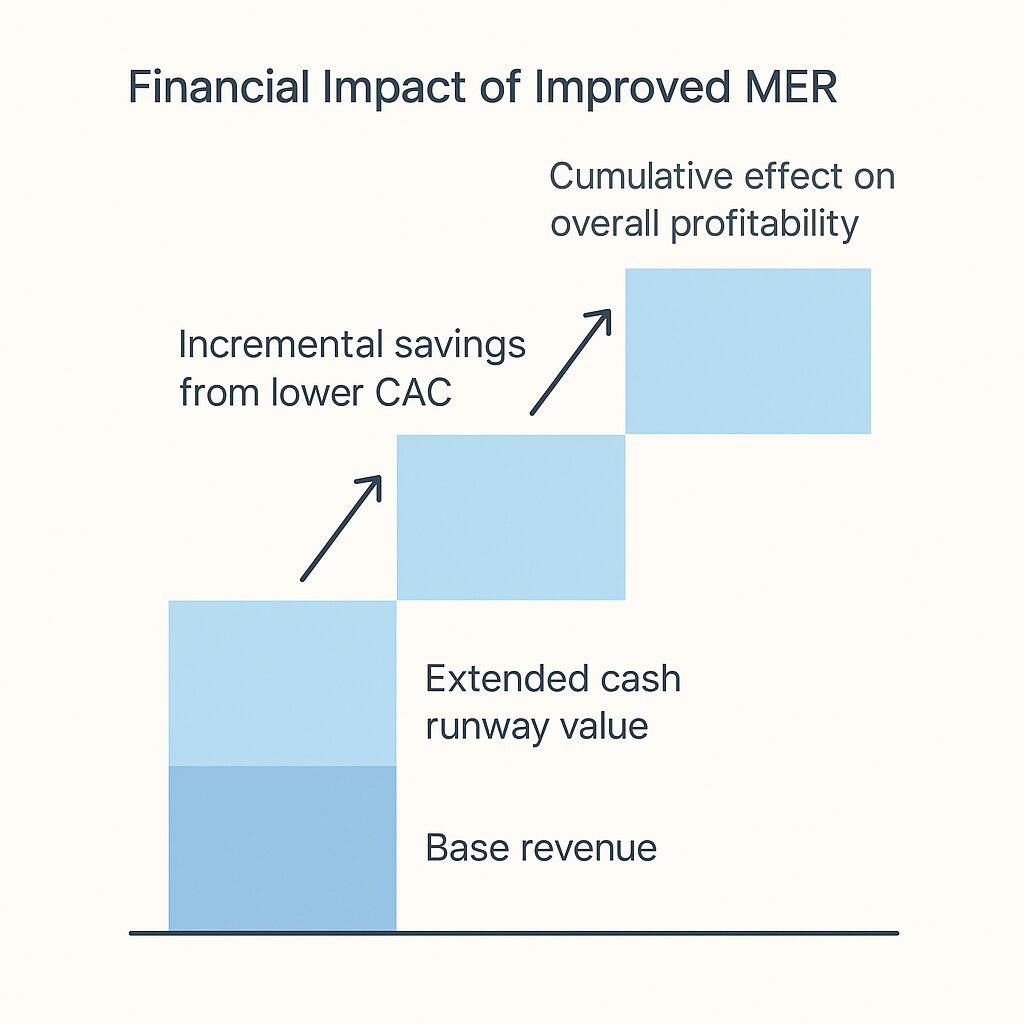
Financial Impact: Improving MER from 3:1 to 5:1 can extend cash runway by 40-60% at current spend levels, while reducing customer acquisition costs by 20-30%. For a brand spending $ 100,000 monthly on marketing, this improvement could free up $ 20,000-$ 30,000 for growth initiatives or extend the runway by 6-12 months.
Common Pitfalls:
- Relying solely on platform ROAS without considering incrementality
- Ignoring seasonal fluctuations when setting benchmarks
- Optimizing for short-term MER at the expense of brand-building investments
According to Keen’s 2025 Marketing Insights Report, a healthy MER is typically 3.0 or higher, with larger companies often achieving MERs above 10, while smaller brands generally fall in the 2.4–5.1 range
2. Channel Attribution & Media Mix
Focus: Incrementality vs Last-Click Bias
Channel attribution represents one of the most sophisticated B2C brand health metrics, measuring actual marketing impact rather than correlation. Traditional attribution models often overvalue bottom-funnel channels while undervaluing brand-building activities, which are crucial for long-term success.
Essential Attribution Metrics:
- Incremental Revenue: Revenue explicitly generated due to marketing activities
- Organic Halo Effects: Branded search and direct traffic lift following paid campaigns
- Cross-Channel Synergy: How different marketing channels amplify each other’s performance
Advanced Implementation:
- Conduct regular incrementality tests using geo-holdouts or audience splits
- Monitor branded search volume spikes during and after advertising campaigns
- Track direct traffic increases correlating with paid advertising activities
- Implement marketing mix modeling (MMM) for comprehensive attribution analysis
Strategic Applications: Use attribution insights to optimize media spend allocation, identify undervalued channels, and understand the actual customer journey across touchpoints.
Financial Impact: Proper attribution modeling typically reveals that 15-25% of conversions previously attributed to direct or organic traffic result from paid media, leading to more accurate budget allocation and improvements of 10-20% in overall marketing efficiency.
Common Pitfalls:
- Over-relying on last-click attribution, which undervalues upper-funnel activities
- Ignoring view-through conversions and assisted conversions
- Failing to account for organic halo effects from paid campaigns
Competitive Positioning: Attribution insights reveal which channels competitors may be undervaluing, creating opportunities for market share gains through strategic channel investment.
3. Email & SMS Metrics
Email and SMS remain among the highest-ROI channels for B2C brands, making these metrics essential for overall brand health measurement.
Core Email & SMS Brand Health Metrics:
- Open Rate: Benchmark 20-25% for retail brands
- Click Rate: More predictive than open rates; target 2-5% depending on industry
- Unsubscribe Rate: Maintain below 0.5% monthly for healthy list growth
- Revenue per Send: Total revenue generated divided by emails sent
While open rates can provide directional context, they should never be treated as a standalone success metric, especially given changes in privacy, such as iOS Mail Protection. Instead, focus on click-through rates, revenue per send, and lifetime value by email segment to measure performance and customer impact.
Advanced Engagement Tracking:
- Lifetime Value by Email Segment: Track how different subscriber groups perform over time
- Engagement Scoring: Create composite scores based on opens, clicks, and purchase behavior
- Deliverability Health: Monitor sender reputation, spam complaints, and inbox placement
Optimization Framework: Segment lists based on purchase behavior and engagement history, implement automated flows for different customer journey stages, and continuously test send times, subject lines, and content formats.
Financial Impact: Forbes recently reported that optimizing email programs typically generates a $38-$42 ROI per dollar spent, with segmented campaigns showing 14-18% higher open rates and 58-101% higher click-through rates than non-segmented sends.
Common Pitfalls:
- Focusing on vanity metrics (open rates) instead of revenue-driving metrics
- Over-sending to subscribers, leading to increased unsubscribe rates
- Neglecting deliverability factors that impact inbox placement
Competitive Positioning: Email excellence creates a defensible competitive moat—while competitors can copy and create, they cannot access your subscriber relationships and first-party data.
In 2024, data showed that for every $1 spent on email marketing, B2C brands achieved an average ROI of $36, or 3600%, with some outperforming benchmarks by earning up to $45 per dollar spent
4. Referral & Word-of-Mouth Impact
Word-of-mouth marketing often drives the highest-quality customers with superior lifetime value, making referral tracking a crucial metric for B2C brand health.
Referral Measurement Framework:
- Referral Traffic: Direct measurement through tracking links and referral codes
- User-Generated Content (UGC): Monitor brand mentions, hashtags, and customer-created content
- Brand Ambassador ROI: Revenue generated per dollar invested in influencer partnerships
Tracking Implementation:
- Social Listening: Monitor brand mentions across platforms and review sites
- Referral Program Performance: Track participation rates, conversion rates, and customer quality
- NPS Correlation: Link Net Promoter Scores to actual referral behavior
Strategic Benefits: Referral programs create compounding growth effects, reduce customer acquisition costs, and provide authentic social proof that improves conversion rates across all marketing channels.
Financial Impact: Referred customers typically have a 16-25% higher lifetime value and a 37% higher retention rate. A 10% increase in referral rate can reduce overall customer acquisition costs by 15-20% while improving customer quality.
Common Pitfalls:
- Offering inadequate incentives that don’t motivate sharing behavior
- Complicated referral processes that reduce participation rates
- Failing to track and optimize referral program performance
Competitive Positioning: Strong referral programs generate network effects that competitors struggle to replicate, as they rely on authentic customer advocacy—something money can’t easily buy.
5. Customer Satisfaction & NPS
Customer satisfaction metrics are closely correlated with retention, lifetime value, and organic growth, making them fundamental metrics for B2C brand health.
Essential Satisfaction Metrics:
- Net Promoter Score (NPS): Measures customer loyalty and likelihood to recommend
- Customer Satisfaction Score (CSAT): Immediate post-interaction satisfaction
- Customer Effort Score (CES): Ease of completing desired actions
Implementation Best Practices:
- Post-Purchase Surveys: Send within 24-48 hours of delivery for optimal response rates
- Review Sentiment Analysis: Monitor review platforms and implement feedback loops
- Transactional vs Relationship Surveys: Use both to capture immediate and long-term satisfaction
Strategic Applications: Use satisfaction data to identify detractors early for proactive retention, improve product quality based on feedback, and correlate satisfaction scores with customer lifetime value predictions.
Financial Impact: Increasing NPS by 10 points typically correlates with 10-15% revenue growth, while reducing churn by just 5% can increase profitability by 25-125% depending on customer lifetime value ratios.
Common Pitfalls:
- Surveying customers too frequently, leading to survey fatigue
- Collecting feedback without acting on insights, damaging customer trust
- Focusing only on positive feedback while ignoring critical improvement areas
Competitive Positioning: Superior customer satisfaction creates sustainable competitive advantages that are difficult to replicate, necessitating investments in organizational culture and operational excellence.
According to Bain & Company, increasing NPS by 10 points can lead to a revenue increase of 10–15% and reduce customer churn by 20–25% (Bain & Company, 2023).
6. Return Rate & Refunds
Return metrics provide valuable insights into product quality, customer expectations, and operational efficiency—key indicators of overall brand health.
Critical Return Metrics:
- Return Volume by Category/SKU: Identify products requiring quality improvements
- Return Reason Analysis: Categorize returns by quality, sizing, shipping, or expectation issues
- Return Rate Trends: Monitor monthly and seasonal patterns
Optimization Strategies:
- Quality Improvement: Use return data to identify and address product issues
- Expectation Management: Improve product descriptions and imagery to reduce expectation gaps
- Sizing Solutions: Implement sizing guides and virtual try-on tools for high-return categories
Financial Impact Analysis: Calculate customer acquisition costs, including return processing, and monitor return processing time and customer experience—track repeat purchase rates among customers who have previously returned items.
Financial Impact: Reducing return rates by 2-3% typically improves gross margins by 4-6%, while excellent return experiences can increase customer lifetime value by 10-15% through enhanced satisfaction and repeat purchases.
Common Pitfalls:
- Focusing only on return rate reduction without considering the customer experience impact
- Inadequate return reason tracking, missing opportunities for product improvements
- Slow return processing that damages customer relationships
Competitive Positioning: Brands with superior return experiences can capture market share from competitors with restrictive return policies, particularly in categories where returns are common.
7. Inventory Turnover & Stockouts
Inventory management has a direct impact on customer satisfaction and revenue potential, making these operational metrics crucial for assessing the health of B2C brands.
Key Inventory Health Metrics:
- Stockout Rate: Percentage of SKUs out of stock during peak demand periods
- Lost Revenue Due to Stockouts: Quantify revenue impact of inventory shortages
- Inventory Turnover Rate: Speed of inventory conversion to sales
Customer Experience Impact:
- Monitor customer behavior when preferred items are unavailable
- Implement back-in-stock notifications and waitlists
- Track customer retention rates following stockout experiences
Optimization Framework: Use demand forecasting based on historical data and trend analysis, balance holding costs with stockout risks through safety stock management, and develop reliable supply chains with backup suppliers.
Financial Impact: Reducing stockout rates from approximately 15% during peak periods to below 5% can boost annual revenue by around 10% and cut operational costs by nearly 30%, according to the Altavant Consulting Report 2025).
Common Pitfalls:
- Over-stocking slow-moving items while under-stocking popular products
- Inadequate demand forecasting leading to preventable stockouts
- Ignoring customer behavior changes during stockout periods
Competitive Positioning: Consistently available inventory creates a competitive advantage, particularly during peak seasons when competitors may struggle with stockouts, allowing for market share capture.
8. Loyalty Program Participation
Loyalty programs drive repeat purchases and provide valuable customer data, making participation metrics essential B2C brand health indicators.
Core Loyalty Metrics:
- Points Redeemed: Measures active engagement with loyalty benefits
- Tier Upgrades: Tracks customer progression through loyalty levels
- Repeat Buyer Rate: Percentage of customers making multiple purchases
Program Performance Analysis:
- Engagement Analysis: Identify the most valuable rewards and program features
- Lifetime Value Comparison: Compare the LTV of loyalty members versus non-members
- Personalization Opportunities: Use loyalty data for targeted marketing
Strategic Benefits: Loyalty programs reduce price sensitivity through value-added benefits, increase purchase frequency and average order value, and provide zero-party data for enhanced personalization.
Financial Impact: Loyalty program members typically generate 12-18% more revenue annually than non-members, with retention rates 25-35% higher than those of non-members. The zero-party data collected enables personalization that can increase conversion rates by 15-20% (CROPink 2025).
Common Pitfalls:
- Creating complex programs that confuse rather than engage customers
- Offering rewards that don’t align with customer preferences
- Neglecting program promotion and member communication
Competitive Positioning: Well-designed loyalty programs create switching costs that make it difficult for competitors to poach customers, while the data collected enables more effective competitive responses.
9. Brand Search Volume & Share of Voice
Measuring brand awareness through search behavior provides critical insights into market position and competitive standing.
Brand Awareness Metrics:
- Monthly Branded Search Growth: Track volume and trends for brand-specific queries
- Competitive Benchmarking: Compare share of voice against key competitors
- Search Intent Analysis: Understand customer search behavior related to your brand
Monitoring Tools and Techniques:
- Google Trends: Monitor brand search interest over time
- Keyword Research: Track brand-related search terms and variations
- Competitive Intelligence: Monitor competitor brand search strategies
Strategic Applications: Correlate brand search volume with advertising activities, identify seasonal interest patterns, and develop content strategies based on brand-related search queries.
Financial Impact: Brands with a substantial share of voice typically achieve 15-25% higher conversion rates and 20-30% lower customer acquisition costs compared to competitors with a weak brand presence.
Brandwatch highlights that stronger SOV is tied to measurable improvements in brand awareness, recall, and consideration, which drive acquisition and cost efficiency. Nielsen studies show that brands achieving “excess Share of Voice” (SOV > market share) grow faster, typically 0.5–4% per year faster than peers (Wynter).
Common Pitfalls:
- Focusing only on branded search volume without considering competitive context
- Ignoring negative search trends that may indicate brand health issues
- Failing to capitalize on seasonal search volume spikes
Competitive Positioning: Share of voice analysis reveals market gaps and emerging threats, enabling proactive competitive responses. Brands dominating relevant search queries can effectively capture competitor traffic and defend market position.
10. Social Engagement & Creator ROI
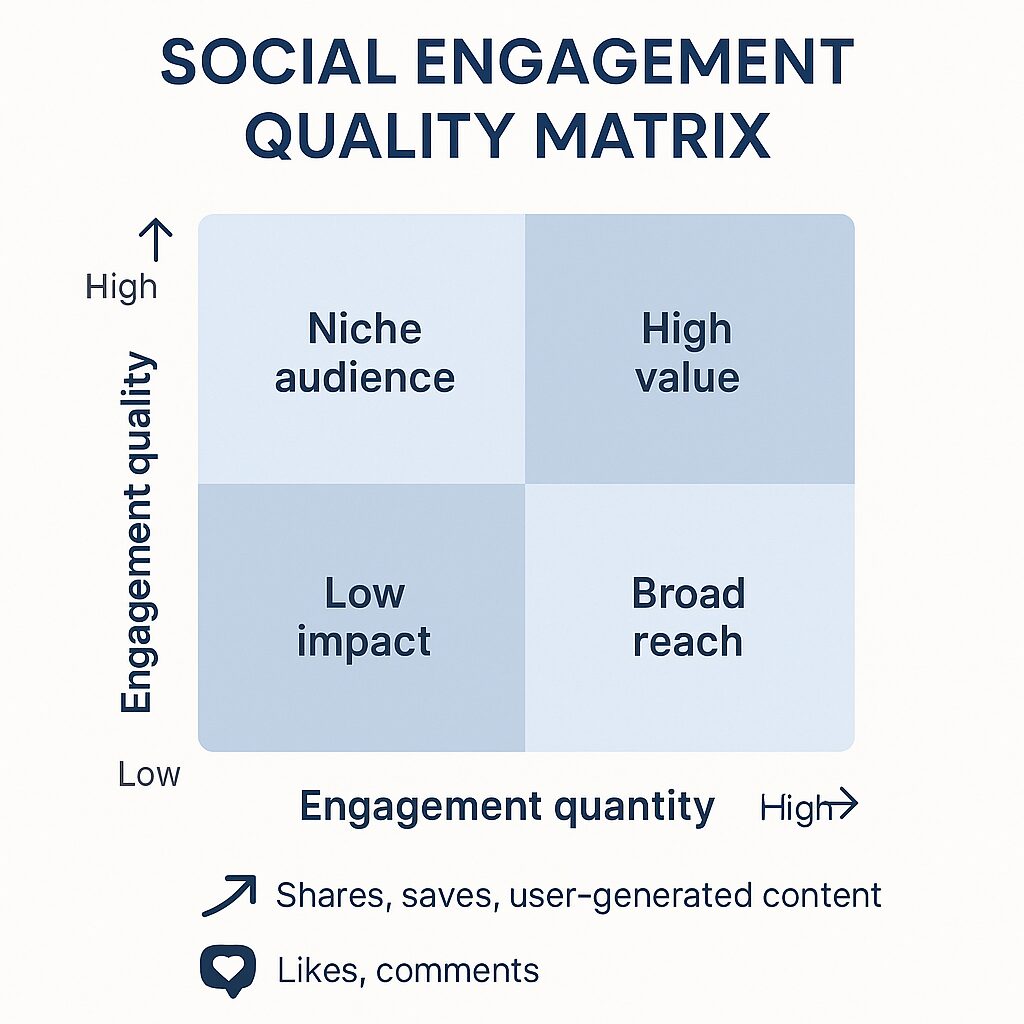
Social media engagement quality matters more than follower count for B2C brands, making these metrics crucial for assessing brand health.
Quality Engagement Metrics:
- Comments, Saves, Shares vs Likes: Prioritize meaningful engagement over vanity metrics
- Creator-Specific ROAS: Measure revenue generated from influencer partnerships
- Halo Lift: Indirect impact of social campaigns on other marketing channels
Performance Measurement Framework:
- Engagement Rate: Total meaningful engagements divided by reach
- Social Commerce Conversion: Direct sales generated through social platforms
- Brand Mention Sentiment: Monitor conversation tone and brand perception
Optimization Strategies: Test different content formats to identify highest-engagement types, evaluate influencer partnerships beyond vanity metrics, and focus on fostering genuine customer communities.
Financial Impact: Quality social engagement typically generates 6-8x higher conversion rates than paid advertising, while authentic user-generated content can reduce content creation costs by 30-50% while improving conversion rates by 4-6%.
Common Pitfalls:
- Prioritizing follower count over engagement quality
- Partnering with influencers whose audiences don’t align with target customers
- Creating overly promotional content that reduces organic reach
Competitive Positioning: Defensible competitive moats are created by strong social communities, while competitors can copy content strategies; authentic customer relationships and community engagement, however, cannot be replicated once they have been built over time.
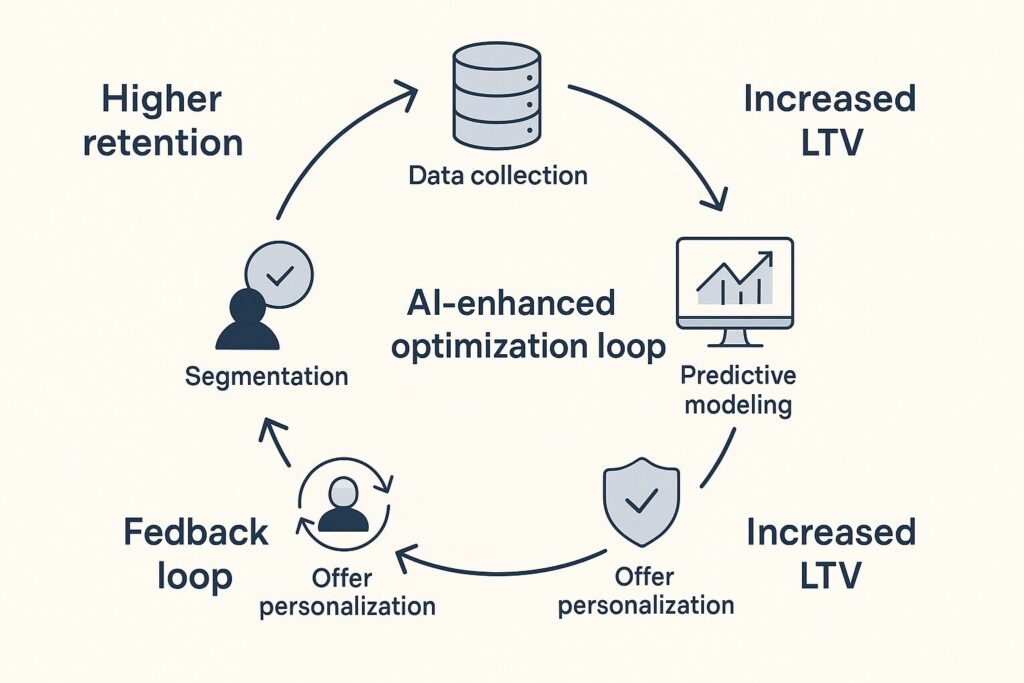
BONUS SECTION: AI-Enhanced B2C Brand Health Metrics
Predictive Churn Modeling
Advanced B2C brand health metrics now include AI-powered predictive analytics that identify at-risk customers before they churn, enabling proactive retention efforts.
Implementation Components:
- Behavioral Signal Analysis: Monitor engagement patterns, purchase frequency, and support interactions
- Predictive Scoring: Assign churn probability scores to individual customers
- Automated Interventions: Trigger retention campaigns based on churn risk scores
Next-Best-Offer Models
AI-powered recommendation engines predict which products or offers will resonate with individual customers, optimizing both customer experience and revenue.
Strategic Applications:
- Personalized Recommendations: Product suggestions based on purchase history and behavior
- Promotional Targeting: Optimize discount offers and promotional campaigns
- Cross-Sell Optimization: Identify complementary products for existing customers
Audience Clustering & Segmentation
Advanced analytics identify customer segments that traditional demographic analysis might miss, providing deeper insights into customer behavior patterns.
Advanced Techniques:
- Behavioral Clustering: Group customers based on purchase patterns and engagement
- Lookalike Modeling: Identify prospects similar to high-value customers
- Dynamic Segmentation: Adjust customer segments based on evolving behavior
LTV Prediction by First-Party Signals
Predictive lifetime value models use first-party data to forecast customer value, optimizing acquisition and retention strategies.
Data Integration:
- First-Party Data Sources: Website behavior, purchase history, engagement patterns
- Predictive Modeling: Machine learning algorithms for future value forecasting
- Strategic Implementation: Adjust acquisition spending based on predicted LTV
Frequently Asked Questions About B2C Brand Health Metrics
1. What are the most critical B2C brand health metrics for new businesses?
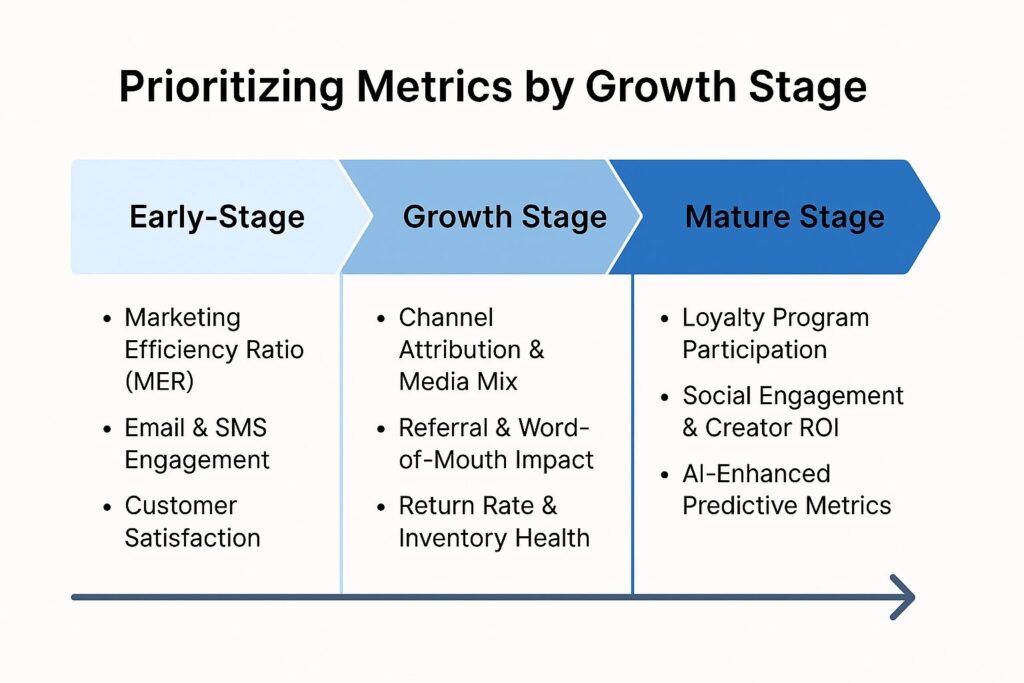
New B2C businesses should focus on Marketing Efficiency Ratio (MER), customer satisfaction scores, and basic email engagement metrics. These foundational metrics provide immediate insights into marketing effectiveness and customer experience without requiring complex attribution modeling. Begin with these core metrics before moving on to advanced analytics.
2. How often should I monitor B2C brand health metrics?
Monitor real-time metrics, such as website traffic and social media engagement, daily. Operational metrics, including email performance and inventory levels, should be reviewed on a weekly basis. Monthly, review strategic metrics like NPS and customer satisfaction. Conduct comprehensive brand health reviews quarterly to identify trends and adjust strategies accordingly.
3. What’s a good benchmark for Marketing Efficiency Ratio in B2C?
Most successful B2C brands target MER between 4:1 and 6:1, though this varies significantly by industry. E-commerce brands typically achieve a 3:1 to 5:1 margin expansion due to competitive markets, while subscription services often see a 6:1 to 10:1 margin expansion. Focus on improving your margin expansion trends rather than comparing them to industry averages.
4. How do I measure the actual incremental revenue generated by marketing?
Measure incremental revenue through controlled testing using geo-holdouts, audience splits, or marketing mix modeling. Start with simple A/B tests, where you turn off specific channels for control groups and then measure the revenue differences. This approach eliminates attribution bias and shows actual marketing impact.
5. Which B2C brand health metrics best predict long-term success?
Net Promoter Score (NPS) combined with customer lifetime value (LTV) provides the strongest predictor of long-term success. NPS indicates customer loyalty and referral potential, while LTV shows financial sustainability. Together, they reveal both customer satisfaction and economic viability.
6. How do I optimize email marketing beyond basic open rates?
Focus on revenue per send, customer lifetime value by email segment, and engagement scoring rather than vanity metrics. Implement advanced segmentation based on purchase behavior, test different sending frequencies, and create automated flows for various customer journey stages.
7. What’s the best way to track word-of-mouth marketing impact?
Combine multiple measurement approaches: implement referral tracking systems, monitor social media mentions and UGC, track branded search volume spikes, and survey customers about brand discovery. Use UTM codes for trackable referral links and create shareable customer experience moments.
8. How do I know if my return rate indicates issues with brand health?
Return rates vary by category, but a rate of 5-10% is generally acceptable for most B2C brands. Fashion typically sees a 15-30% increase, while electronics average a 5-15% increase. Focus on return reasons rather than just rates—quality issues require different solutions than sizing or style preference returns.
9. What AI-enhanced metrics should growing B2C brands prioritize?
Begin with predictive churn modeling and customer lifetime value prediction to gain immediate, actionable insights. Once you have sufficient data, implement next-best-offer models for personalization and audience clustering for better segmentation. Prioritize collecting clean first-party data before implementing advanced AI analytics.
10. How do B2C brand health metrics differ from B2B metrics?
B2C brand health metrics focus more on emotional engagement, social proof, and individual customer behavior, while B2B metrics emphasize account-based measurements and longer sales cycles. B2C metrics include social engagement, user-generated content, and personal customer satisfaction, whereas B2B focuses on account health scores and pipeline metrics.
Related Articles
The Best B2B vs B2C Testing Strategies for 2025
The Ultimate B2C Growth Metrics Guide to Explode Your Revenue
B2C Brand Health Metrics Guide: Unlock Growth Now
How to Create a Winning Data-Driven Sales Strategy
Proven B2B Outreach Strategy That Gets Real Results
B2B Metric Frameworks Infographics: Unlock Growth & Profits Now
About the Author
I write about:
- AI + MarTech Automation
- AI Strategy
- COO Ops & Systems
- Growth Strategy (B2B & B2C)
- Infographic
- Leadership & Team Building
- My Case Studies
- Personal Journey
- Revenue Operations (RevOps)
- Sales Strategy
- SEO & Digital Marketing
- Strategic Thinking
📩 Want 1:1 strategic support?
🔗 Connect with me on LinkedIn
📬 Read my playbooks on Substack
Leave a Reply