AI Case Study: How does a neighborhood florist compete with large chains and still deliver on time?
In this AI case study, I demonstrate how I applied AI automation at Lia’s Flowers to forecast demand, reduce waste, and streamline weekly operations while maintaining a personal touch.
Once we confirmed the model was working, the focus shifted from one-off wins to building traction in a repeatable way. I moved from gut instinct to a simple system: forecasting demand, optimizing delivery, and tracking results with dashboards.
Each adjustment was small, but together they created measurable growth. This playbook captures the process I used, the lessons learned, and where AI made the difference.
The Challenge
When I joined the weekly planning team, I found that inventory relied on the Owner/Florist’s gut instinct.
- Overstock meant wasted stems.
- Understock meant missed revenue.
- Delivery routes overlapped, creating delays and wasted fuel.
I wanted to test whether a simple AI approach could improve both inventory and Delivery without overcomplicating the shop’s workflow.
The Approach
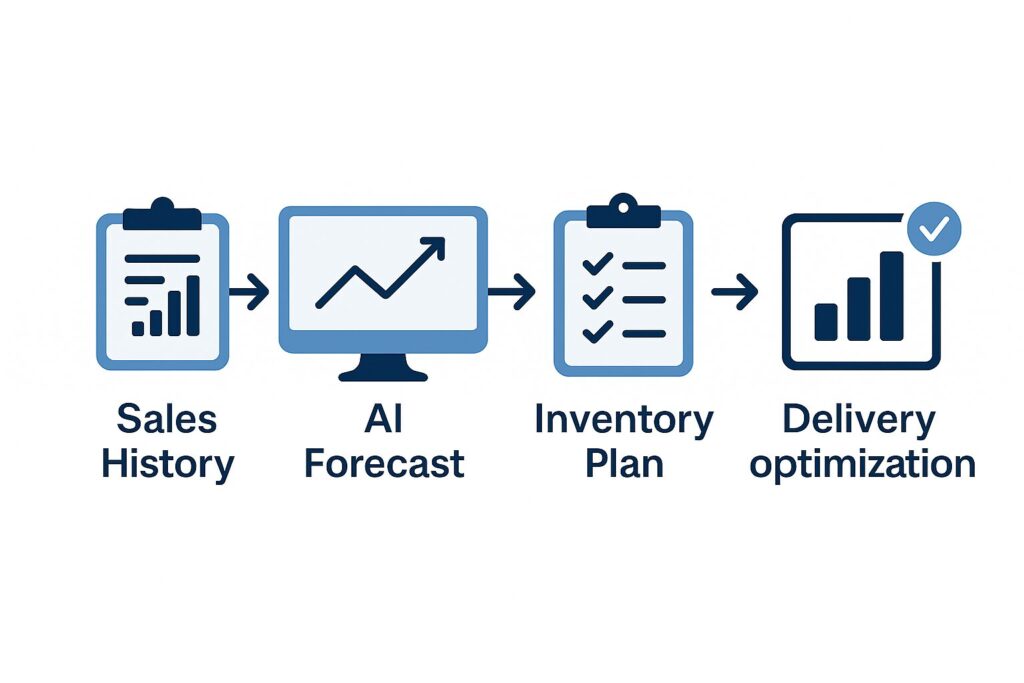
I shifted our planning process from gut instinct to a structured, AI-enabled system that I designed and implemented. Instead of treating AI as a black box, I built a repeatable framework around it. I applied three connected layers that turned raw data into better decisions:
1) Forecasting Demand
- I collected weekly sales history by stem type.
- I mapped spikes from local events, such as Valentine’s Day and graduations.
- I trained a lightweight model to forecast demand by week and stem.
- I adjusted the ordering to smaller, more frequent batches to minimize waste.
2) Optimizing Delivery
- I connected forecasts to a route planner.
- I clustered deliveries by ZIP code and timing.
- I reduced overlapping trips, which improved punctuality and lowered fuel use.
3) Tracking with Dashboards
- I built a simple dashboard to track usage, shrink rate, and fulfillment.
- I introduced it in weekly team meetings to build accountability and adoption.
My Role in Applying AI
AI provided the predictions, but my role was to apply them in context.
- Problem Framing: I defined waste and delivery inefficiencies as the focus.
- System Setup: I structured the necessary data inputs, including weekly sales history and event calendars, to ensure accurate and efficient operation.
- AI Interaction: I trained, tested, and adjusted the forecasting model, validating outputs against real results.
- Operational Rollout: I built dashboards for visibility, conducted team reviews, and integrated them into the planning process.
- Change Leadership: I coached the owner and her staff on data input and interpreting outputs and balancing AI suggestions with customer service.
The Results
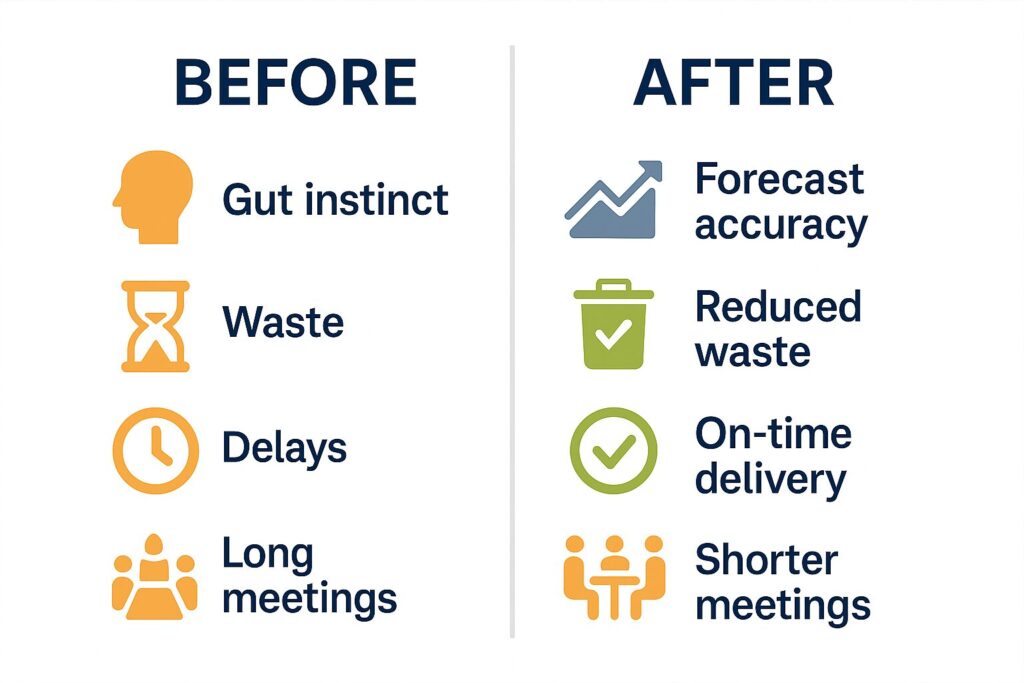
Before AI
- Orders based on intuition.
- Waste averaged 3–4 buckets of stems per week.
- Delivery routes overlapped, causing delays.
- Staff spent hours reconciling spreadsheets.
After AI Forecasting and Dashboards
- Flower waste dropped 20% in the first season.
- On-time deliveries improved by 15%.
- By introducing AI forecasts and dashboards, I reduced weekly planning meetings from 90 minutes to 30 minutes.
- Staff spent more time with customers and floral design.
- Customers noticed fresher flowers, fewer delays, and smoother service.
Lessons Learned
Positive Lessons: What Worked
- AI works at any scale. Small businesses benefit when data is structured every week.
- Forecasting and logistics together multiply value. One without the other leaves gaps.
- Visibility drives adoption. Dashboards build trust and help staff buy in.
- Frequent, smaller adjustments reduce waste. Weekly ordering beats large monthly buys.
- Human judgment still matters. AI supports, people lead.
Negative Lessons: What Was Hard
- Data prep takes time. Cleaning weekly sales and event data required discipline before the model was useful.
- Forecasts are only as good as inputs. Unexpected events (funerals, sudden weather shifts) still caused misses.
- Change isn’t automatic. Some staff resisted at first, worried that AI would replace their judgment. Coaching was needed.
AI Case Study Tools and Frameworks Used
- Forecasting Model (AI-driven)
- AI’s Role: Trained on weekly sales history and seasonal event data, the model predicted demand by stem type. It learned from past spikes (Valentine’s, graduations) and adjusted forecasts week over week.
- Impact: Reduced over-ordering, cut waste by 20%, and shifted purchasing to smaller batches.
- Your Role: Collected/cleaned the data, defined what “waste” meant, and validated the outputs against real results.
- Delivery Planner (AI optimization layer)
- AI’s Role: Optimized delivery routes by clustering addresses and timing, minimizing overlaps.
- Impact: Improved on-time delivery by 15% and reduced fuel/time costs.
- Your Role: Integrated AI outputs with delivery schedules, balanced algorithmic routes with real-world constraints (traffic, driver knowledge).
- Dashboards (AI-powered visibility)
- AI’s Role: Aggregated live forecasts and actuals into accuracy, waste %, and fulfillment metrics. Surfaced patterns automatically (e.g., which stems routinely missed forecasts).
- Impact: Shortened weekly planning meetings from 90 minutes to 30 minutes and built staff trust in the system.
- Your Role: Designed the dashboard logic, chose which metrics mattered, and coached staff on interpretation.
Why this makes AI clear
- Forecasting → machine learning patterns in demand.
- Delivery → optimization algorithms, not just manual clustering.
- Dashboards → automated visibility, not static spreadsheets.
For years I ordered by instinct, and we always had either too many stems going to waste or too few to meet demand. With AI forecasting, I finally feel in control of both our orders and our deliveries — and I have more time to focus on my customers and designs.”
— Lia, Owner of Lia’s Flowers
AI Case Study Conclusion
AI did not replace the florist’s eye or her team. It strengthened them. Forecasting gave the owner clearer demand signals, delivery optimization reduced wasted trips, and dashboards made results visible in weekly meetings. Together, these tools cut waste by 20%, improved on-time deliveries, and freed staff to focus on customer service and design. Most importantly, the shop kept the personal neighborhood feel that customers expect while operating with more precision.
From Spreadsheets to Smart Dashboards
Lia’s Flowers AI Ops Dashboard
AI Case Study Snapshot: From Data to Delivery.
Forecast vs Actual, Roses
Weekly stemsWaste by Stem Type
Shrink %Forecast Accuracy, All Stems
% accuracyDeliveries by ZIP
Share %AI Ordering Plan – Current Week
| Stem | Forecast | Planned | AI Score |
|---|
Logistics Performance
| Metric | Value |
|---|---|
| On time % | 94% |
| Avg delivery time | 2.1 hrs |
| Challenges | Traffic, weather |
What the Dashboard Taught Us
The AI Ordering Plan was not about getting every forecast perfect. It was about showing where our instincts could have gone wrong and where AI made the difference. A few examples stood out:
- Orchids: The forecast called for 390 stems, but past practice would have pushed closer to 480. That kind of over-ordering often led to waste. AI helped us cut the order back and avoid unsold stems.
- Sunflowers: The forecast suggested 640 stems, but we planned for 720 after factoring in a local graduation spike. AI flagged the risk of undersupply, and the adjustment kept us in stock during peak demand.
- Gerbera Daisies: Confidence was lower than usual. The forecast signaled seasonal swings, which prompted us to keep the order smaller and watch usage more closely.
- Ruscus: AI spotted slower usage patterns, which allowed us to trim the order and prevent overbuying greens.
The key learning: AI didn’t replace decisions, it sharpened them. By surfacing risks and confidence levels, it showed us where to hold back and where to lean in.
Related Case Studies
AI Case Study: How Florists Optimize With Practical AI
AI Marketing Stack Integration: Smarter Attribution, Better ROI
AI Digital Marketing Strategy: Powerful Results MyEListing Achieved
Case Study: High-Trust Teams With Proven Results
Sales Ops Case Study: From Chaos to Repeatable Growth
MyEListing Growth Experimentation Case Study: Driving Real Results
About the Author
I write about:
- AI + MarTech Automation
- AI Strategy
- COO Ops & Systems
- Growth Strategy (B2B & B2C)
- Infographic
- Leadership & Team Building
- My Case Studies
- Personal Journey
- Revenue Operations (RevOps)
- Sales Strategy
- SEO & Digital Marketing
- Strategic Thinking
📩 Want 1:1 strategic support?
🔗 Connect with me on LinkedIn
📬 Read my playbooks on Substack
Leave a Reply