Editor’s Note: This article is part of a 2-part B2C metrics series on StrategicAILeader.com. In Part 1, we focus on growth metrics that drive revenue acceleration and customer acquisition. In Part 2, we break down brand health metrics that indicate long-term strength and market positioning. Together, these guides provide leaders with a comprehensive view of how to scale revenue today while safeguarding brand equity for tomorrow.
Part 1: Table of Contents:
- Executive Summary
- What Most Leaders Get Wrong About B2C Growth Metrics
- The Core Framework: 10 B2C Growth Metrics That Matter
- 1. Website Traffic & Engagement (The Top of Your Funnel)
- 2. Conversion Rate (CVR): The Great Equalizer
- 3. Customer Acquisition Cost (CAC): Your Growth Reality Check
- 4. Average Order Value (AOV): The Profit Multiplier
- 5. Revenue per Visitor (RPV): The Ultimate Efficiency Metric
- 6. Customer Lifetime Value (LTV): The Long Game
- 7. Purchase Frequency & Time Between Orders: The Rhythm of Revenue
- 8. Retention Rate: The Profit Protector
- 9. Cohort Analysis: The Time Machine
- 10. Revenue Breakdown: The Complete Picture
- Real-World Application: How These B2C Growth Metrics Saved a $2M Revenue Drop
- Metrics to Stop Tracking: The Noise Reduction Guide
- The Bottom Line: Metrics That Make You Money
- Frequently Asked Questions
- 1. What's the difference between B2C growth metrics and B2B metrics?
- 2. How often should I review these B2C growth metrics?
- 3. What's a reasonable Customer Acquisition Cost (CAC) for my industry?
- 4. How do I calculate the Customer Lifetime Value (LTV) of a new business?
- 5. Which metric should I focus on first if I'm starting?
- 6. How do privacy changes (like iOS 14.5) affect these metrics?
- 7. What is the best way to benchmark my metrics against those of my competitors?
- 8. How do seasonal businesses handle these metrics differently?
- 9. Should small businesses track all 10 of these metrics?
- 10. What tools do you recommend for tracking customer growth metrics?
- Related Articles
Executive Summary
Successful B2C businesses don’t just collect data; they strategically focus on the 10 essential B2C growth metrics that drive profitable growth. This comprehensive guide empowers every strategic leader to master these key metrics, providing them with the knowledge they need to make informed decisions.
The Core Framework:
- Website Traffic & Engagement – Quality indicators beyond raw volume
- Conversion Rate (CVR) – The great equalizer across channels and devices
- Customer Acquisition Cost (CAC) – Your growth reality check
- Average Order Value (AOV) – The fastest profit multiplier
- Revenue per Visitor (RPV) – Ultimate efficiency metric
- Customer Lifetime Value (LTV) – The long-term value predictor
- Purchase Frequency – Understanding your revenue rhythm
- Retention Rate – The profit protector
- Cohort Analysis – Your business time machine
- Revenue Breakdown – Complete performance picture
Metrics to Eliminate:
This guide also identifies vanity metrics that divert focus from fundamental growth drivers, including social media follower counts, page views per session, and email open rates (without context), as well as excessive emphasis on competitive comparisons. The most successful B2C leaders track 5-7 metrics maximum.
Key Takeaways:
- Focus on value metrics over vanity metrics—track what drives decisions, not what looks good in presentations.
- Your LTV should be at least 3x your CAC for sustainable growth
- Mobile conversion rates often lag desktop by 50%+ but represent a growing traffic share
- Cohort analysis reveals actual customer value better than historical averages
- Weekly operational reviews plus monthly strategic deep dives optimize performance
Implementation Priority:
Start with Revenue per Visitor (RPV) as your foundational metric. It combines traffic quality, conversion efficiency, and transaction value into one actionable number. Add Customer Acquisition Cost and Average Order Value next, then build toward the complete framework as your analytics mature.
The companies that win in today’s competitive landscape aren’t those with the most sophisticated dashboards; they’re the ones with the most precise focus on metrics that directly impact profitable growth.
Here’s a question that keeps me up at night: Why do so many companies drown in data but starve for insights?
I recently spoke with a founder who proudly showed me their “comprehensive” analytics dashboard: 47 different metrics displayed on three monitors, resembling a mission control center. But when I asked him which three numbers predicted their quarterly revenue, he went quiet. That’s when it hit me: we’re all measuring everything, but most aren’t measuring what matters.
If you’re leading a team, running a division, or building a business, you need to know precisely which B2C growth metrics separate the signal from the noise. Because here’s the hard truth: tracking the wrong metrics isn’t just wasteful, it’s dangerous. It gives you the illusion of control while your business slowly bleeds revenue. This cautionary note is intended to raise your awareness of potential pitfalls and guide you towards the most suitable metrics.
Let me walk you through the Top 10 B2C growth metrics that move the needle, plus the framework I use to make sense of it all. These B2C growth metrics have been battle-tested across various consumer industries and will provide you with the clarity you need to drive profitable growth.
What Most Leaders Get Wrong About B2C Growth Metrics
Early in my career, I made the classic rookie mistake. More data meant better decisions. I’d spend hours building elaborate reports that looked impressive in board meetings, but they told me nothing about what to do the next morning.
The wake-up call came during a quarterly review, when our CEO asked me why our customer acquisition cost had doubled, while our revenue remained flat. I had beautiful charts showing website traffic was up 40%, email open rates were climbing, and social media engagement was through the roof. But I couldn’t explain why none of that translated to profitable growth.
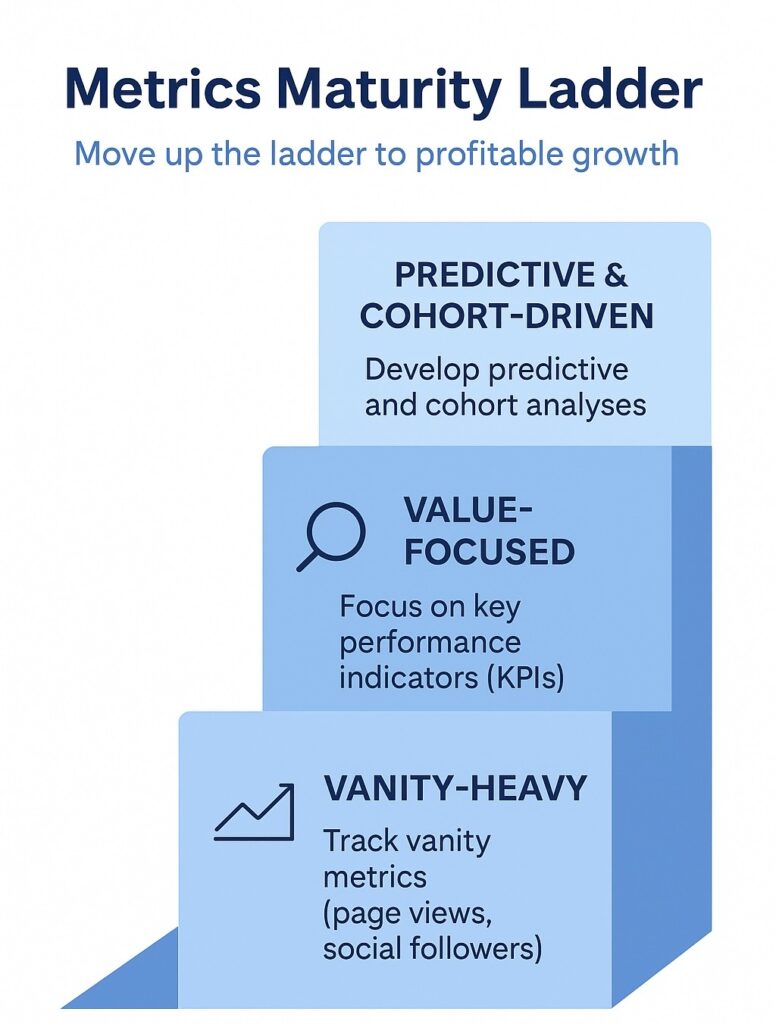
That’s when I learned the difference between vanity metrics and value metrics. Vanity metrics make you feel good: they almost always go up and to the right. Value metrics make you money: they directly correlate with business outcomes and guide your next action. For instance, while a high number of social media followers might make you feel good, a high customer lifetime value (LTV) or a low customer acquisition cost (CAC) directly contribute to your business’s bottom line.
According to a recent study by McKinsey, companies that focus on the right B2C growth metrics see 15-20% improvements in marketing ROI within the first year. However, here’s the kicker: most consumer businesses track an average of 12-15 customer metrics, when only 4-6 of these drive meaningful decisions.
The mindset shift that changed everything for me? Stop asking “What can we measure?” and ask “What do we need to know to grow faster?” This shift in perspective is not just a change in approach; it’s an inspiration to focus on the metrics that truly matter for your business’s growth.
The Core Framework: 10 B2C Growth Metrics That Matter
Think of customer growth metrics as vital signs for your business. Just like a doctor doesn’t need to monitor every possible biomarker to keep you healthy, you don’t need to track every possible metric to grow your business.
Here’s my framework for the B2C growth metrics that predict and drive revenue growth:
1. Website Traffic & Engagement (The Top of Your Funnel)
Your website traffic metrics are like checking the pulse of your digital presence. However, raw traffic numbers without context are useless—it’s like knowing your heart is beating without knowing if it’s beating too fast.
What to track:
- Sessions and Pageviews: Your baseline volume
- Bounce Rate: Quality indicator (under 40% is generally good for most industries)
- Scroll Depth: How engaged visitors are
- Mobile vs Desktop breakdown: Where your audience lives
- Branded vs Non-Branded traffic: How many people are actively seeking you out
The magic happens when you segment this data. A 50% bounce rate might be terrible for your product pages, but perfectly normal for your blog content. This segmentation enables you to pinpoint areas for improvement and areas of strength, thereby guiding your optimization efforts. Traffic from branded searches converts at 3-5x higher rates than non-branded traffic, so the mix tells you a lot about your brand strength and the effectiveness of your marketing efforts.
2. Conversion Rate (CVR): The Great Equalizer
Conversion rate is where the rubber meets the road. According to Unbounce’s research, the average landing page conversion rate across industries is 2.35%, but the top 25% of pages convert at a rate of 5.31% or higher.
Track conversion rates by:
- Device type: Mobile often converts 2-3x lower than desktop
- Traffic channel: Paid search, organic, social, email, direct
- Product category: Your hero products vs. everything else
- Micro vs Macro conversions: Email signups, downloads, vs. actual purchases
I learned this lesson the hard way when we celebrated a 40% increase in mobile traffic, only to discover mobile conversion rates were half that of desktop. We were losing money on every mobile visitor we drove to our Site.
3. Customer Acquisition Cost (CAC): Your Growth Reality Check
CAC is the metric that distinguishes sustainable businesses from those that burn through cash. However, most people miscalculate it; they only consider paid media spend and overlook the fully loaded cost.
Here’s how to calculate it right:
- Paid Media CAC: Total ad spend ÷ new customers acquired
- Blended CAC: Total marketing spend (including salaries, tools, content) ÷ new customers
- Organic CAC: Cost of content, SEO, social media ÷ organic acquisitions
The golden rule? Your customer lifetime value should be at least 3x your CAC. If it’s not, you’re either spending too much to acquire customers or not extracting enough value from them.
4. Average Order Value (AOV): The Profit Multiplier
AOV is one of the fastest levers you can pull to increase revenue without acquiring more customers. A 10% increase in AOV often has the same impact as a 10% increase in traffic, but it’s usually much easier to achieve.
Track AOV by:
- Seasonal patterns: Q4 often sees 20-30% higher AOV due to gift-giving
- Device type: Desktop users typically have higher AOV
- Customer segment: First-time vs. returning customers
- Marketing channel: Email subscribers often have higher AOV than social traffic
The secret sauce? Bundling and upselling. Amazon’s “frequently bought together” feature is estimated to increase their AOV by 12-15% across categories.
These B2C growth metrics are compelling because they focus on the consumer journey from awareness to advocacy. Unlike B2B metrics focusing on account-based measures, these consumer-focused metrics help you understand individual customer behavior at scale.
5. Revenue per Visitor (RPV): The Ultimate Efficiency Metric
Revenue per Visitor (RPV) is the ultimate foundational metric because it gives you a single, actionable number that captures the entire customer journey. It reflects the combined power of your traffic quality, conversion efficiency, and transaction value. By focusing on RPV first, you ensure that your marketing, product, and growth teams are aligned on what truly matters: turning visitors into revenue as efficiently as possible.
Improving RPV isn’t just about driving more traffic or increasing conversion rates in isolation. It’s about orchestrating all your efforts to maximize the value of every visitor, making RPV the ideal starting point and a unifying metric for all growth and efficiency discussions.
RPV is calculated as:
Total Revenue ÷ Total Website Visitors
This metric is gold because it distills traffic quality, conversion rate, and order value into one number. An improvement in RPV means you’re getting better at the entire customer journey, not just one piece.
Benchmark RPV by:
- Traffic source: Organic search often has 2-3x higher RPV than social media
- Device: Understanding the mobile vs. desktop gap
- Campaign: Which marketing efforts drive profitable traffic
6. Customer Lifetime Value (LTV): The Long Game
LTV is the most important metric you’ll track, and it’s also the most misunderstood. Most people calculate it based on historical averages, but smart operators use cohort-based LTV to predict future value.
Track LTV snapshots at:
- 30 days: Early indicator of customer quality
- 60 days: Better predictor for most businesses
- 90 days: Solid foundation for decision-making
- 180+ days: Long-term value for strategic planning
Segment by:
- First purchase source: Google Ads customers vs. organic vs. referrals
- Season of acquisition: Holiday customers often have different patterns
- Device used for first purchase: Mobile vs. desktop acquisition behavior
7. Purchase Frequency & Time Between Orders: The Rhythm of Revenue
Understanding your customers’ purchasing rhythm is akin to knowing the heartbeat of your business. Your engagement score indicates when to re-engage, when to worry about churn, and how to structure your retention campaigns effectively.
Key metrics:
- Repeat purchase rate: What percentage of customers buy again within 30, 60, or 90 days?
- Average time between orders: Your natural replenishment cycle
- Purchase frequency by cohort: How behavior changes over time
This data helps you predict when customers are about to run out of consumable products. It enables you to identify your most valuable customer segments for durable goods.
8. Retention Rate: The Profit Protector
It costs 5-25x more to acquire a new customer than to retain an existing one. Yet most businesses spend 80% of their budget on acquisition and 20% on retention. That’s backwards.
Track retention at multiple intervals:
- 30-day retention: Early warning system
- 90-day retention: Solid predictor of long-term value
- Annual retention: Strategic planning baseline
For subscription businesses, monthly churn rates below 5% are generally considered healthy; however, this varies significantly by industry and price point.
9. Cohort Analysis: The Time Machine
Cohort analysis is your business time machine, showing how customer behavior evolves. Instead of looking at averages across all customers, you track specific groups (cohorts) based on when they made their first purchase.
This analysis reveals:
- Which acquisition sources produce the most valuable customers
- How long does it take customers to reach profitability
- Whether your retention is improving or declining over time
- The actual impact of product or service changes
I use cohort analysis to answer questions like: “Are the customers we acquired last quarter more or less valuable than the ones we acquired a year ago?”
10. Revenue Breakdown: The Complete Picture
Finally, segment your revenue to understand where growth is coming from:
New vs. Returning Customer Revenue:
- Healthy businesses typically see 20-30% of revenue from new customers
- If it’s higher, you might have a retention problem
- If it’s lower, you might have a growth problem
Product Category Performance:
- Which categories drive the most revenue?
- Which has the highest margins?
- Which creates the most repeat customers?
Price Tier Analysis:
- Are customers trading up or down over time?
- How does customer lifetime value vary by price point?
Real-World Application: How These B2C Growth Metrics Saved a $2M Revenue Drop
Let me share how this framework played out in real life. I was consulting with an e-commerce company that experienced a 15% quarter-over-quarter decline in revenue, despite a 20% increase in traffic.
Here’s what the metrics revealed:
- AOV had dropped 25% due to a change in product mix
- Mobile conversion rate fell 40% after a site redesign
- Customer acquisition cost increased 30% as iOS 14.5 privacy changes hit Facebook ads
- 90-day LTV for new cohorts was down 20% compared to pre-pandemic customers
The vanity metrics looked great-traffic and email subscribers were growing, and social engagement was climbing. But the value metrics told the real story: we were acquiring lower-quality customers at a higher cost, and they weren’t buying as much.
The fix involved three strategic moves:
- Prioritized mobile conversion optimization (quick 15% boost in mobile CVR)
- Restructured product bundles to increase AOV by 18%
- Shifted budget from Facebook to Google and email marketing, where CAC was 40% lower
Within two quarters, revenue was back above previous highs, and LTV/CAC ratios were the healthiest they’d been in two years. Focusing on the right B2C growth metrics, rather than vanity numbers, empowers your brand to drive sustainable, profitable growth.
Quick Wins: How to Implement This Week
You don’t need to build Rome in a day. Here are three things you can do this week to start getting better insights from your B2C growth metrics:
Monday: Audit Your Current Dashboard
- List every metric you currently track
- For each one, ask: “If this number doubled tomorrow, what would I do differently?”
- If you can’t answer that question, stop tracking that metric
Wednesday: Set Up Cohort Tracking
- Start with simple 30-day cohorts based on first purchase date
- Track revenue per cohort over the first 90 days
- Adopting a lifetime value perspective alone can transform how you understand and approach customer value.
Friday: Calculate Your Real CAC
- Include everything: ad spend, team salaries, tools, overhead
- Calculate by channel, not just blended
- Compare to your 90-day LTV by channel
Bonus: Create Your Weekly Review. Pick five metrics from this list and review them every Friday. I use: Traffic (by source), Conversion Rate (by device), CAC (by channel), AOV (vs. last month), and 30-day LTV (by cohort).
The key is consistency. Better to track 5 metrics religiously than 20 metrics sporadically.
Metrics to Stop Tracking: The Noise Reduction Guide

Now that we’ve covered what to measure, let’s discuss what to stop measuring. These vanity metrics might make you feel good, but they can also divert your focus from what truly drives growth.
Social Media Vanity Metrics
- Followers, Likes, and Shares: Unless you can directly tie these to revenue, they’re just ego boosts. Companies with 100K followers generate less revenue than those with 5K engaged subscribers.
- Impressions and Reach: These numbers look impressive in reports, but tell you nothing about purchase intent or customer quality.
Website Engagement Theater
- Time on Site (without context): A high time on Site could indicate either engaged users or confused users who are unable to find what they’re looking for. It isn’t very sensible without a conversion context.
- Page Views per Session: This metric assumes more pages equals better engagement, but often the best customer experience is getting to checkout in as few clicks as possible.
Email Marketing Fluff
- Open Rates (as a standalone metric): With iOS Mail Privacy Protection, open rates are becoming increasingly unreliable. Focus on click-through rates and revenue per email instead.
- List Size Growth: A list of 10,000 engaged subscribers beats 50,000 unengaged ones every time.
The “More is Better” Trap
- Total Sessions Without Segmentation: 100,000 visitors from irrelevant traffic sources won’t move your business forward. Quality over quantity, always.
- Brand Awareness Surveys: Unless you’re Coca-Cola with a massive brand budget, awareness doesn’t pay the bills. Focus on purchase intent instead.
Competitive Comparison Obsession
- Competitor Traffic Estimates: These tools are notoriously inaccurate and distract you from your growth. You can’t control their numbers, only yours.
- Market Share Calculations: These are often based on unreliable data and change too slowly to guide tactical decisions.
Here’s my rule of thumb: If you can’t connect a metric to a specific action you’d take based on its movement, stop tracking it. Your attention is finite, and every minute spent analyzing vanity metrics is a minute not spent optimizing what drives revenue.
The most successful B2C leaders I work with typically track 5-7 metrics maximum. They know exactly what each number means for their business and what action to take when it moves up or down.
The Bottom Line: Metrics That Make You Money
After analyzing B2C growth metrics for dozens of consumer businesses, I’ve learned that the companies that win aren’t the ones with the most data; they have the most precise focus.
Your B2C growth metrics should tell a story. They should explain where your customers come from, their value, and what keeps them coming back. Most importantly, they should guide your next decision.
The framework I’ve shared here isn’t just theory; it’s battle-tested across consumer industries, from e-commerce to direct-to-consumer brands and retail. However, remember that these B2C growth metrics are tools, not goals. The goal is sustainable, profitable growth. The metrics help you navigate there faster.
Once you’re grounded in these core growth metrics, the next frontier is brand health — the deeper signals that reveal your true relationship with customers. Part 2 of this guide dives into the essential B2C brand health metrics that move beyond revenue, helping you build loyalty, reduce churn, and create a defensible competitive moat. Let’s explore how to measure not just growth, but lasting brand strength.
By focusing on these high-impact metrics, you’ll build a stronger, more profitable brand foundation. Do you still have questions about how to apply these in your business? Let’s tackle some of the most common ones below.
Frequently Asked Questions
1. What’s the difference between B2C growth metrics and B2B metrics?
B2C growth metrics focus on individual consumer behavior at scale, emphasizing quick purchase decisions, emotional triggers, and repeat buying patterns. B2B metrics typically focus on longer sales cycles, account-based measures, and relationship-driven conversions. Consumer-focused metrics help you understand mass market behavior and optimize for volume and frequency.
2. How often should I review these B2C growth metrics?
I recommend conducting weekly reviews of operational metrics (traffic, conversion rate, and customer acquisition cost) and monthly in-depth analyses of strategic metrics (lifetime value, cohort analysis, and retention). Quarterly reviews should focus on trends and strategic adjustments. Consumer behavior can change quickly, so more frequent monitoring is often beneficial.
3. What’s a reasonable Customer Acquisition Cost (CAC) for my industry?
CAC varies dramatically according to industry and business models. A good rule of thumb is that your Customer Lifetime Value should be at least 3:1 compared to your CAC. SaaS companies often have CACs of $200-$400, whereas e-commerce companies might have CACs of $20-$100.
4. How do I calculate the Customer Lifetime Value (LTV) of a new business?
For new companies, start with predictive LTV using early behavioral indicators—track 30, 60, and 90-day revenue per customer, then project based on retention rates. Adjust your calculations as you gather more data over 6-12 months.
5. Which metric should I focus on first if I’m starting?
Start with Revenue per Visitor (RPV), as it combines traffic quality, conversion rate, and order value into a single, actionable metric. Once you have that baseline, add Customer Acquisition Cost and Average Order Value.
6. How do privacy changes (like iOS 14.5) affect these metrics?
Privacy changes primarily impact attribution and tracking accuracy, not the underlying business metrics. Rather than relying solely on platform-reported numbers, focus on collecting first-party data, utilizing server-side tracking, and blending performance metrics.
7. What is the best way to benchmark my metrics against those of my competitors?
8. How do seasonal businesses handle these metrics differently?
Seasonal businesses should track metrics by comparable periods (e.g., November 2024 vs. November 2023) and focus on cohort analysis by acquisition season. Build separate models for peak and off-peak periods.
9. Should small businesses track all 10 of these metrics?
Start with five core metrics: Traffic, Conversion Rate, Customer Acquisition Cost, Average Order Value, and Customer Lifetime Value. Add others as your business grows and you have more resources for analysis.
10. What tools do you recommend for tracking customer growth metrics?
For most businesses, Google Analytics 4, combined with your e-commerce platform’s built-in analytics, provides a comprehensive overview of the basics. Consider tools like Klaviyo for email analytics, Triple Whale for e-commerce attribution, or Mixpanel for more advanced cohort analysis as your business scales.
Related Articles
Part 2 – B2C Brand Health Metrics Guide: Unlock Growth Now
How to Create a Winning Data-Driven Sales Strategy
Proven B2B Outreach Strategy That Gets Real Results
B2B Metric Frameworks Infographics: Unlock Growth & Profits Now
About the Author
I write about:
- AI + MarTech Automation
- AI Strategy
- COO Ops & Systems
- Growth Strategy (B2B)
- Infographic
- Leadership & Team Building
- Personal Journey
- Revenue Operations (RevOps)
- Sales Strategy
- SEO & Digital Marketing
- Strategic Thinking
📩 Want 1:1 strategic support?
🔗 Connect with me on LinkedIn
📬 Read my playbooks on Substack
Leave a Reply