Editor’s Note: This article is part of a two-part B2B metrics series on StrategicAILeader.com. In Part 1, we focus on revenue metrics every leader must track to align growth with performance. In Part 2, we break down efficiency metrics that help leaders scale smarter without wasted spend. Both guides are designed to provide you with practical frameworks and clear examples that you can put into action today.
Part 1: Table of Contents:
- Executive Summary
- Why B2B Revenue Metrics Are the Leader’s Growth Compass
- Annual Recurring Revenue (ARR): Your North Star
- Monthly Recurring Revenue (MRR): The Early Warning System
- Bookings vs. Billings: Cash Flow Clarity
- Customer Lifetime Value (CLTV): The Sustainability Scorecard
- Customer Acquisition Cost (CAC): The True Price of Growth
- CAC Payback Period: How Quickly You Recover
- Customer & Pipeline Metrics: Predicting Future Revenue
- Retention & Health Metrics: Protecting Your Base
- Closing Perspective: The Growth Engine Blueprint
- FAQ
Executive Summary
The B2B Revenue & Growth Metrics Playbook for Leaders
Why this matters:
Most B2B leaders focus on top-line revenue without seeing the deeper signals hidden in growth metrics. This playbook breaks down the essential revenue and pipeline metrics every COO needs to build a resilient, scalable business.
Key metrics covered:
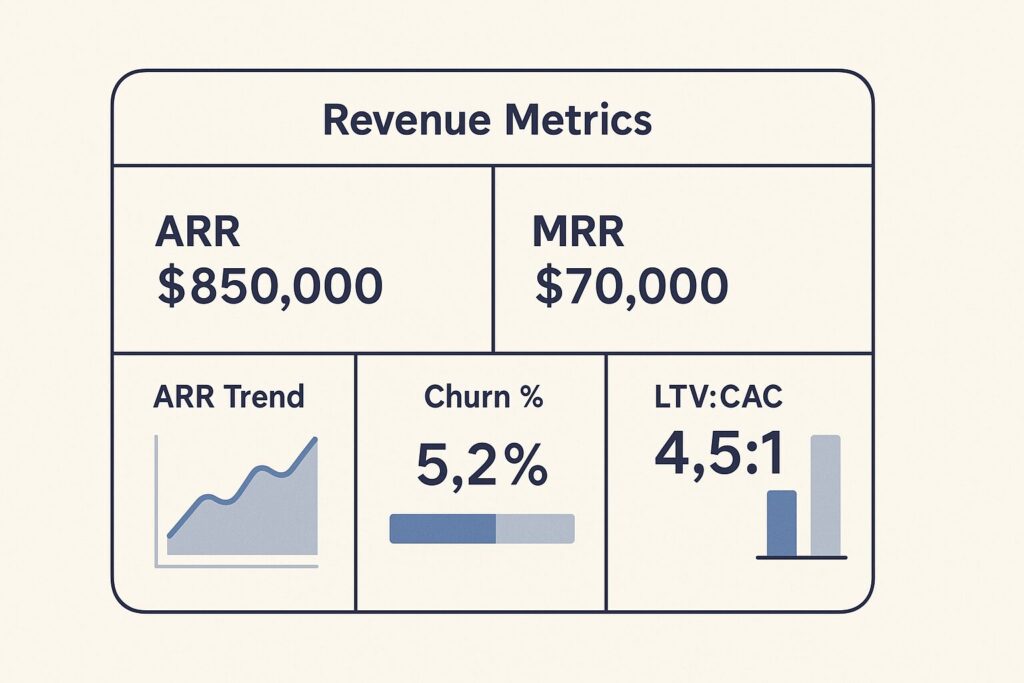
- ARR & MRR: Your actual growth anchors. Avoid distorted projections and set accurate investment priorities.
- Bookings vs. Billings: Aligning Revenue Forecasts with Cash Flow Realities.
- CLTV & CAC: Understand customer value and acquisition costs to guide sustainable growth strategies.
- Payback Period: Manage cash burn and optimize timing for scaling.
- LVR & Funnel Conversion: Help predict pipeline health and identify bottlenecks early, so you can address them before they impact revenue.
- Churn & Retention Analysis: Go beyond surface-level percentages and uncover the proper health of your customer base.
What you’ll gain:
- Practical calculation methods and benchmarks
- Common operator pitfalls and real-world stories
- Actionable insights to align teams and resources around the right growth levers
Bottom line:
Revenue metrics are more than just numbers; they serve as your strategic compass. Mastering them sets the foundation for operational clarity and long-term growth.
With over 25 years of experience leading SEO strategy and scaling Realtor.com from $75 million to over $500 million in revenue, with SEO driving 74% of all leads and revenue, I’ve learned a fundamental truth: success isn’t luck. It is operational discipline and mastery of B2B revenue metrics at the leadership level.
This guide is a culmination of my experience as VP of SEO and Marketing, as well as COO, designed to help B2B companies navigate the complex world of B2B revenue metrics and growth indicators.
Many leadership teams make decisions based on what we call ‘vanity metrics’ or incomplete data. These metrics may appear favorable on paper, but they don’t provide a true reflection of your business’s health. At Realtor.com, we didn’t just measure traffic or leads in isolation. We built an integrated system that connected organic visibility to pipeline health, sales velocity, and bottom-line contribution. Without that rigor, we would not have been able to scale while maintaining efficiency and strategic focus.
This guide is not just a collection of metrics, but a roadmap to help you avoid costly missteps and build stronger, more resilient businesses. I wrote this guide to share knowledge that took decades to acquire, shaped by mistakes, lessons, and late-night whiteboard sessions trying to decode growth patterns. I want to help other leaders avoid these costly missteps and build stronger, more resilient businesses.
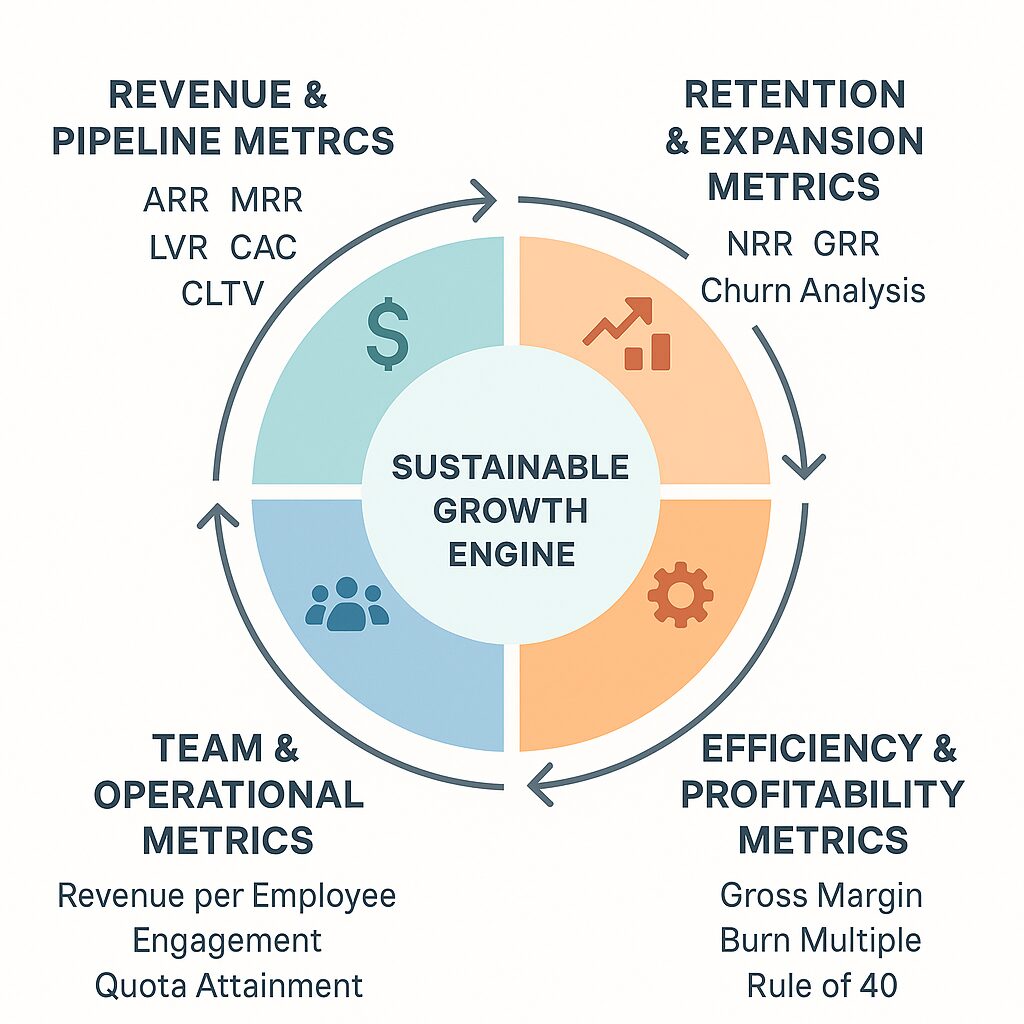
In this first part, we’ll break down the revenue and pipeline metrics, as well as retention and expansion metrics, that form the heartbeat of a B2B business. (E.g., Top Part of the Growth Engine)
Why B2B Revenue Metrics Are the Leader’s Growth Compass
Annual Recurring Revenue (ARR): Your North Star
Many subscription-based B2B companies refer to ARR as their North Star metric. It represents the annualized value of your recurring contracts and is critical for forecasting, valuation, and long-term planning.
Correct calculation: Multiply monthly recurring revenue (MRR) by 12. Only include predictable, contractual revenue streams. If a customer pays $10,000 upfront for a one-year contract, that’s $10,000 ARR. Not $120,000.
What to watch for:
- Seasonality can distort ARR, particularly in enterprise deals that tend to close heavily in Q4.
- Implementation or one-time fees should not be included — doing so inflates growth optics and misguides resource allocation.
Strategic application: ARR should drive your entire resource planning and investment strategy. At a marketing automation company I advised, we discovered that mid-market ARR was growing three times faster than enterprise, despite disproportionate investments in enterprise sales. This insight shifted our go-to-market focus and reshaped hiring priorities.
“ARR should represent only predictable, recurring revenue streams – excluding any one-time fees, professional services, or non-recurring charges.” (Maxio, “ARR definition and best practices”)
Monthly Recurring Revenue (MRR): The Early Warning System
MRR provides a granular, monthly pulse check on your revenue health. Unlike ARR, MRR highlights short-term trends, allowing you to spot problems or growth opportunities more quickly.
Calculation tip: Include only predictable revenue, excluding variable usage fees and one-time charges.
Operational value:
- A sudden slowdown in MRR growth often predicts revenue misses three to six months ahead.
- You can proactively adjust sales incentives, marketing investments, and renewal strategies before any impact shows up in ARR.
At one SaaS company, an unexpected MRR plateau in January helped us avoid a Q2 revenue miss by accelerating customer marketing and creating urgency among at-risk renewals.
Bookings vs. Billings: Cash Flow Clarity
- Bookings: Total value of contracts signed within a period, regardless of payment schedule.
- Billings: Actual invoiced revenue during a period.
Why this matters:
- Bookings help you forecast future revenue and resource needs.
- Billings drive cash flow and liquidity.
If you sign a $120,000 annual contract billed monthly, you record $120,000 in bookings but only $10,000 per month in billings. Misunderstanding this dynamic can lead to hiring or spending ahead of cash, resulting in operational stress.
Customer Lifetime Value (CLTV): The Sustainability Scorecard
CLTV is more than a number — it is your business model’s sustainability report card.
Correct calculation:
ARPU (average revenue per user) × Gross Margin% × Expected customer lifespan.
Key nuance: Segment by acquisition channel and customer cohort. Your enterprise customers may have a CLTV of $100,000, while SMB customers may only generate $8,000. Using blended averages masks profitability differences and leads to poor CAC strategies.
Common pitfalls:
- Overestimating retention or using outdated cohort assumptions.
- Ignoring gross margin, which inflates perceived value.
At a B2B platform I advised, leadership used a five-year lifespan estimate; however, recent cohorts churned after only 18 months. Their CLTV was overstated by 60%, fueling unsustainable customer acquisition spending.
Strategic use: CLTV informs CAC thresholds, product investments, and the allocation of customer success resources. If your enterprise CLTV is $100,000, you can justify higher CAC and robust onboarding. You need a low-touch, efficient model if your SMB CLTV is $5,000.
Customer Acquisition Cost (CAC): The True Price of Growth
CAC is often underestimated or miscalculated.
True calculation:
(Total sales costs + Total marketing costs + Tools + Allocated overhead) ÷ New customers acquired in that period.
What most miss:
- The calculation includes only direct ad spending, excluding salaries, commissions, tools, events, and executive time.
- Failing to align CAC calculations with the sales cycle length. For example, if your average sales cycle is six months, some of this month’s new customers were influenced by spending in prior quarters.
Strategic impact: CAC defines your funding runway and growth strategy. At a fintech company I advised, we discovered enterprise CAC was $45,000, yet SMB CAC was only $3,000 with similar LTV ratios. This discovery completely shifted our market focus.
CAC Payback Period: How Quickly You Recover
This metric reveals how long it takes to recoup your CAC investment.
Formula:
CAC ÷ (MRR per customer × Gross Margin%).
Benchmarks:
- Under 12 months is healthy for B2B SaaS.
- Up to 18 months can be acceptable for high-LTV enterprise segments.
Why it matters: More extended payback periods increase burn and require more working capital. With a 10-month payback and rapid hiring, you must ensure sufficient runway to avoid cash flow crises.
According to ProfitWell, “Customer Acquisition Cost: The Complete Guide”, “Including salaries, marketing spend, tools, and overhead, the true CAC is often underestimated – yet it defines your growth runway and profitability.“
Customer & Pipeline Metrics: Predicting Future Revenue
Lead Velocity Rate (LVR): Your Growth Predictor
LVR measures the month-over-month growth in qualified leads entering your pipeline.
Why it’s crucial:
- Revenue is a lagging indicator, while LVR is a leading one.
- A drop in LVR today means fewer deals closed in 1–2 quarters.
Operational application:
- Track LVR by channel and segment to understand marketing efficiency.
- At a marketing tech company, we observed a decline in paid LVR, while content marketing LVR increased by 15% per month. We reallocated budgets, preventing a pipeline shortfall that would have appeared months later.
According to Jason Lemkin, SaaStr, “Why Lead Velocity Rate is the Most Important Metric in SaaS”, “LVR is one of the few true leading indicators of future revenue growth – if your qualified lead volume is not growing, your sales won’t grow either.“
Conversion Rates by Funnel Stage: Revealing Bottlenecks
Track conversion rates at each funnel stage:
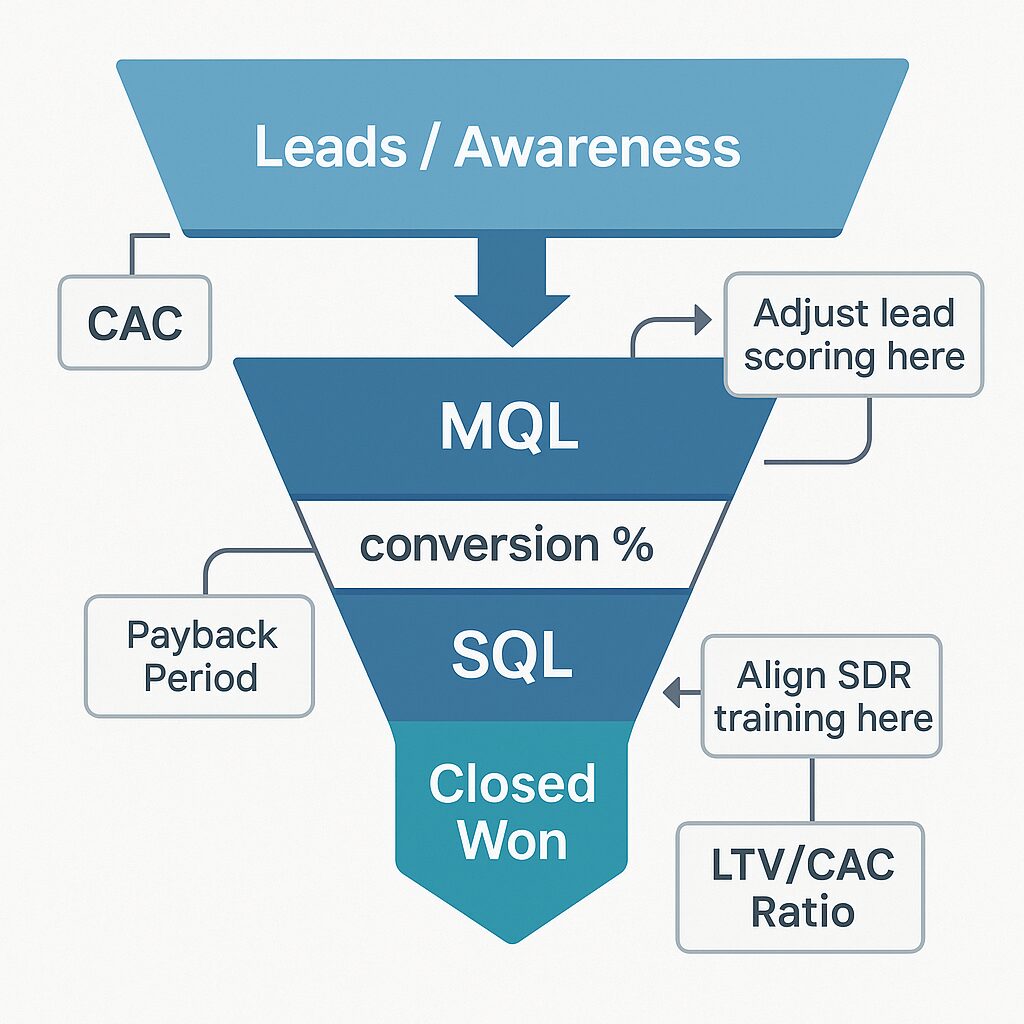
- Awareness → MQL (Marketing Qualified Lead)
- MQL → SQL (Sales Qualified Lead)
- SQL → Closed Won
What to look for:
- Low MQL-to-SQL conversion signals poor lead quality or handoff issues.
- Low SQL → Closed rates indicate pricing, competitive, or sales execution problems.
Operator tip: When MQL → SQL conversion dropped from 40% to 25% at one company, we reviewed lead scoring and SDR training, uncovering a misalignment in qualification criteria. Fixing this restored conversion efficiency and pipeline predictability.
Sales Cycle Length: Timing Your Engine
Sales cycle length determines cash flow timing, resource planning, and revenue predictability.
Typical benchmarks:
- SMB: 30–60 days
- Mid-market: 90–120 days
- Enterprise: 6–12 months
Operational impact:
Longer cycles mean larger pipeline requirements and higher cash burn before revenue recognition. At a data analytics firm, we reduced enterprise cycle time by 30% by involving procurement teams earlier and clarifying technical requirements upfront.
Retention & Health Metrics: Protecting Your Base
Logo Retention vs. Revenue Retention: Beyond Churn Percentages
Logo Retention: Measures the percentage of customers who renew.
Revenue Retention: Measures the percentage of recurring revenue a company keeps over a given period.
When they diverge:
- High logo retention with low revenue retention suggests you’re losing big customers or experiencing downgrades.
- Low logo retention, combined with high revenue retention, suggests that smaller, low-value customers are churning, while larger accounts are expanding.
Strategic signal: Logo churn often points to onboarding or fit issues. Revenue churn typically indicates competitive dynamics or product gaps.
Cohort Churn Analysis: Time-Based Truth
Instead of only looking at aggregate churn rates, analyze churn by cohort (e.g., customers acquired in a specific quarter) to gain a deeper understanding.
Key insights:
- Reveals retention patterns tied to pricing, onboarding, or product quality changes.
- At an HR tech company I advised, 60% of churn happened between months 8 and 12. Identifying this pattern led us to rebuild our customer success programs, with a focus on year-one milestones.
Closing Perspective: The Growth Engine Blueprint
Revenue and growth metrics do more than measure performance; they shape it. They reveal where to push, where to pull back, and where to re-engineer. Without them, you’re running at full speed with a blindfold.
Many leadership teams celebrate top-line growth but ignore underlying churn or margin erosion until it’s too late. The thriving companies know their numbers deeply, build cross-functional alignment around them, and act on them before the dashboard turns red.
What’s Next
In Part 2, we’ll explore efficiency, profitability, and team health metrics – the backbone of a resilient B2B business that scales and endures.
If you’re ready to deepen your understanding even further, I’ve included answers to some of the most common and pressing questions I hear from B2B COOs and growth leaders. These FAQs are designed to clarify nuances, reinforce key takeaways, and help you put these metrics into action right away.
FAQ
1. What is the most critical revenue metric for a B2B Leader to track?
While each metric serves a purpose, Annual Recurring Revenue (ARR) is often considered the North Star for B2B SaaS and subscription businesses. It reflects predictable revenue and guides long-term strategic planning, valuation, and investment priorities.
2. How does MRR differ from ARR, and why do both matter?
MRR (Monthly Recurring Revenue) provides a more granular, month-to-month pulse on your business, while ARR offers a big-picture annual view. Tracking both helps you identify short-term trends (MRR) and plan for long-term growth (ARR).
3. How should a Leader think about Customer Lifetime Value (CLTV)?
CLTV isn’t just a financial number — it’s a strategic guidepost. It tells you how much you can afford to spend to acquire and retain a customer, informs product investment, and shapes your entire go-to-market strategy.
4. What is a healthy CAC payback period for a B2B business?
CLTV isn’t just a financial number — it’s a strategic guidepost. It tells you how much you can afford to spend to acquire and retain a customer, informs product investment, and shapes your entire go-to-market strategy.
5. How do bookings differ from billings, and why is this important?
Bookings represent the total contract value signed in a period, while billings reflect actual invoiced revenue. Misunderstanding this difference can lead to cash flow issues and resource misallocation.
6. Why is Lead Velocity Rate (LVR) considered a leading indicator?
LVR shows the growth rate of qualified leads entering your pipeline each month. It predicts future revenue and provides an early signal to adjust marketing or sales strategies before pipeline gaps impact results.
7. How can funnel conversion rates uncover operational bottlenecks?
Funnel conversion rates show where leads are dropping off. Low MQL-to-SQL rates may indicate lead quality or handoff problems; low SQL-to-Closed rates might signal pricing issues or sales execution gaps.
8. What is the difference between logo retention and revenue retention?
Logo retention measures the percentage of customers who renew, while revenue retention focuses on the value retained (or expanded) from those customers. Together, they give a fuller picture of customer health and account expansion.
9. How does cohort churn analysis help improve retention?
Cohort analysis reveals when and why customers churn over time. It highlights patterns tied to onboarding, product quality, or support effectiveness, enabling targeted interventions at the most critical moments.
10. How can B2B Leader use these metrics to align cross-functional teams?
Metrics establish a shared language across marketing, sales, product, and customer success teams. By tying objectives to metrics such as ARR growth, churn reduction, or LVR improvement, teams stay aligned with strategic priorities and make data-driven decisions.
Related Articles
How to Create a Winning Data-Driven Sales Strategy
Proven B2B Outreach Strategy That Gets Real Results
B2B Metric Frameworks Infographics: Unlock Growth & Profits Now
About the Author
I write about:
- AI + MarTech Automation
- AI Strategy
- COO Ops & Systems
- Growth Strategy (B2B & B2C)
- Infographic
- Leadership & Team Building
- My Case Studies
- Personal Journey
- Revenue Operations (RevOps)
- Sales Strategy
- SEO & Digital Marketing
- Strategic Thinking
📩 Want 1:1 strategic support?
🔗 Connect with me on LinkedIn
📬 Read my playbooks on Substack
Leave a Reply