In the hypercompetitive landscape of modern business, the difference between companies that scale sustainably and those that plateau isn’t luck. It’s their approach to growth experimentation. While most teams make decisions based on intuition or best practices borrowed from other companies, high-performing organizations have cracked the code on systematic, hypothesis-driven testing that compounds over time into significant competitive advantages.
Consider this: Airbnb attributes much of its early growth to relentless experimentation, running over 1,000 experiments per year across its platform [1]. Netflix famously tests everything from thumbnail images to recommendation algorithms, with some experiments generating millions in additional revenue [2]. These success stories are not outliers, but rather the new standard for how ambitious companies approach growth and expansion, inspiring us all with the potential of growth experimentation.
A growth experimentation playbook is more than just a collection of A/B testing tactics. It’s a comprehensive system that enables teams to rapidly test hypotheses, learn from failures, and scale winning strategies across every stage of the customer journey. This systematic approach not only transforms marketing from a cost center into a predictable revenue engine but also demonstrates the tangible benefits of a growth experimentation playbook.
Today’s most successful startups, marketplaces, direct-to-consumer brands, and SaaS companies have all embraced this methodology. They understand that in an era where customer acquisition costs are rising and organic Reach is declining, the ability to optimize every touchpoint in the user experience systematically isn’t just nice to have. It’s essential for survival.
This playbook will guide you through the exact framework that high-performing teams use to integrate experimentation into their DNA, from establishing the right culture to implementing the systems that enable rapid iteration at scale.
What Makes a Great Testing Culture
Before diving into growth architect frameworks and tools, it’s crucial to understand that successful growth experimentation starts with culture, not technology. The most sophisticated testing platforms in the world won’t help teams that lack the foundational mindset and organizational structure to support continuous experimentation.
Traits of High-Performing Testing Teams
Cross-Functional Collaboration:
Elite growth teams break down silos between marketing, product, engineering, and data science. At companies like Uber and Spotify, growth squads include representatives from each discipline, enabling them to test across the entire user journey without bureaucratic delays. Marketing can’t optimize acquisition while product optimization focuses on activation in isolation. Teams achieve their objectives by coordinating and aligning their efforts.
Hypothesis-Driven Decision Making:
Instead of implementing random tactics, high-performing teams start with clear, testable hypotheses. They ask “What do we believe will happen, and why?” before launching any experiment. This discipline prevents teams from falling into the trap of endless testing without strategic direction.
Data Fluency Across Disciplines:
While not everyone needs to be a statistician, successful growth teams ensure that marketers understand statistical significance, product managers can interpret conversion funnels, and executives can distinguish between correlation and causation. This shared language enables faster decision-making and reduces misinterpretation of results.
Bias Toward Action:
These teams embrace the concept of “strong opinions, loosely held.” They’re willing to place bets based on incomplete information, knowing that well-designed experiments will quickly validate or invalidate their assumptions. They understand that the cost of not testing often exceeds the cost of testing wrong.
Common Pitfalls That Kill Experimentation Velocity
The HIPPO Problem:
When the “Highest Paid Person’s Opinion” overrides data, testing becomes performative rather than genuinely exploratory. Organizations must create psychological safety for junior team members to challenge assumptions and advocate for counterintuitive tests.
Over-Optimization Syndrome:
Some teams become addicted to optimizing small details (such as button colors and micro-copy) while ignoring fundamental strategic questions about positioning, pricing, or product-market fit. The most impactful experiments often challenge core assumptions rather than polish existing approaches.
Analysis Paralysis:
Teams that demand 99% confidence intervals or endlessly debate statistical methods rarely achieve meaningful testing velocity. Perfection is the enemy of good in experimentation. Teams need clear standards for when to ship, iterate, or kill experiments.
Lack of Experiment Velocity:
Perhaps the most critical factor separating high-performing teams from the rest is the sheer number of experiments they conduct. Companies like Amazon and Google run thousands of concurrent experiments because they understand that learning compounds over time. A team running 10 experiments per quarter will never compete with a team running 50.
The 5 Elements of a Successful Growth Experimentation Playbook
1. Clear Goal Alignment
Successful experimentation starts with ruthless clarity about what you’re trying to optimize. High-performing teams organize their testing around specific funnel stages and corresponding metrics, providing a clear and focused direction for their experimentation efforts:
Activation Experiments:
Focus on getting users to experience core product value as quickly as possible. For a marketplace, activation might mean completing the first transaction or receiving the first qualified lead.
Retention Experiments:
Test interventions that increase user engagement over time, such as onboarding sequences, notification strategies, or feature adoption campaigns.
Conversion Experiments:
Optimize the specific actions that drive revenue, whether that’s upgrading to paid plans, increasing order frequency, or expanding account value.
LTV Optimization:
Test strategies that increase the total value customers provide over their lifetime, including cross-selling, upselling, and churn prevention.
Each experiment should align with one of these areas, with success metrics defined before testing. Teams that try to optimize everything simultaneously typically optimize nothing effectively.
2. Prioritization Frameworks
Without a systematic approach to prioritization, teams often test the loudest ideas rather than the most impactful ones. Several frameworks have proven effective:
ICE Framework:
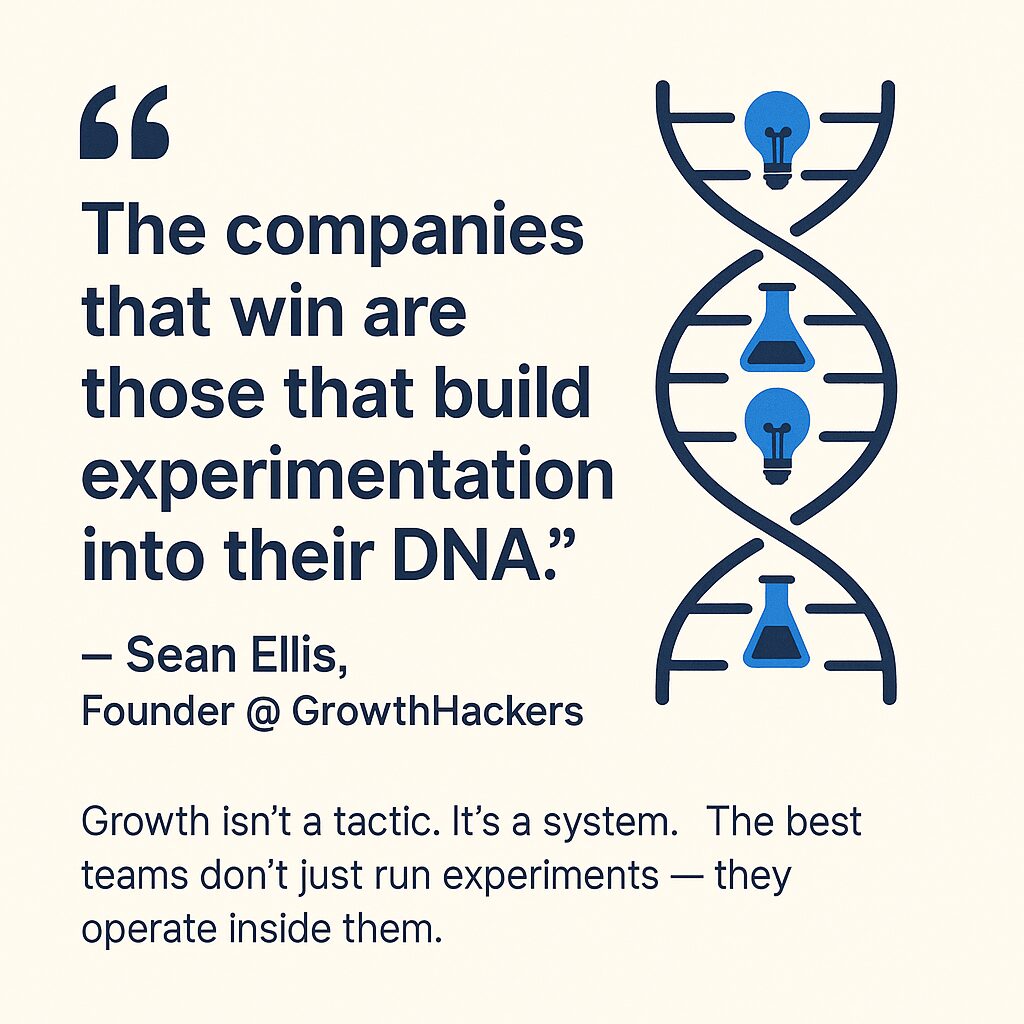
Sean Ellis, one of the pioneers of growth hacking at Dropbox, popularized the ICE framework to help teams prioritize growth ideas quickly and consistently. It delivers speed and simplicity, making it ideal for fast-moving teams that need to triage a backlog of ideas quickly.
You score each experiment across three dimensions on a scale from 1 to 10:
- Impact: How big of a result could this experiment drive if it succeeds? Think revenue, conversion rate, or LTV.
- Confidence: How sure are we that this will work? Are we operating on data, past learnings, or pure intuition?
- Ease: How much Effort will this take to implement? Consider dev hours, design needs, or cross-team dependencies.
Multiply or average the scores (teams do it both ways) to produce a single ICE score. Then sort and prioritize accordingly.
The Formula (Average):|
ICE Score = (Impact + Confidence + Ease) / 3
We divide by 3 because there are three input factors, and average them:
- Normalizes the Score to a 1–10 range (assuming each factor is rated 1–10) if not divide by 10
- Prevents any single category from disproportionately influencing the final result
Makes it easier to compare scores across many ideas on an even scale
In short, the division isn’t about mathematical complexity; it’s about fair weighting and clear prioritization.
The Formula (Multiply):
ICE Score = Impact x Confidence x Ease
- Normalizes the Score by dividing the final score by 10
- Prevents any single category from disproportionately influencing the final result
Why it works:
It’s lightweight, easy to teach, and forces teams to discuss tradeoffs openly. Perfect for weekly growth standups or ideation sessions where momentum matters more than precision.
RICE Framework
The RICE framework, created by Intercom, takes ICE a step further by introducing Reach and formalizing the math.
You’ll score each experiment based on:
- Reach: How many users will this experiment affect over a given period? Typically measured in weekly or monthly users.
- Impact: What is the expected improvement for each user affected? Use a scale (for example, 3 = massive, 2 = high, 1 = medium, 0.5 = low).
- Confidence: How certain are we about both the impact and reach? Again, score from 0 to 100 percent.
- Effort: How many person-days will this take across all roles (dev, design, QA, etc.)?
The Formula:
(Reach × Impact × Confidence) ÷ Effort
Normalizes the Score by dividing the final score by 10
Why it works:
RICE is great for teams juggling dozens of experiments with varying levels of complexity and user impact. It brings structure to decision-making, especially when you’re working with shared product roadmaps or resource constraints.
Pro tip: RICE is more accurate, but also more time-consuming. It works best when you have the infrastructure to consistently estimate Reach and Effort. If your team struggles with that, ICE or ICE-R might be more practical.
ICE-R Framework (My Hybrid Approach)
If ICE is the lightweight model and RICE is the heavyweight, then ICE-R is the sweet spot in the middle.
ICE-R integrates Reach into the classic ICE framework, creating a hybrid prioritization model that strikes a balance between simplicity and strategic nuance. You still score each idea on a scale from 1 to 10, but now with four factors instead of three:
- Impact — How much business value could this test unlock?
- Confidence — How sure are we about the potential outcome?
- Ease — How much Effort is required to execute?
- Reach — How many users or accounts will this test affect?
The beauty of ICE-R is that it helps teams prioritize high-impact, scalable experiments without getting stuck in overcomplicated math. It incorporates the scale-awareness of RICE while maintaining the simplicity and speed of ICE.
The Formula (Average):
ICE-R Score = (Impact + Confidence + Ease + Reach) / 4
You divide by 4 because there are four inputs, and you’re calculating the average Score across all factors. Dividing by four serves a few essential purposes:
Normalizes the Score by dividing the final score by 10
Benefits of Dividing by the Number of Inputs
- Normalizes the Score
- Keeps your ICE-R scores within the same 1–10 range as ICE, making comparison easy across ideas and frameworks.
- Weighs each factor equally
- Without custom weighting, each factor – Impact, Confidence, Ease, and Reach – gets an equal voice in the final Score.
- Maintains simplicity and clarity
- Your team can scan, compare, and rank experiments quickly without advanced math or overthinking.
The Multiply Formula (Aggressive & Scale-Sensitive):
ICE-R Score = (Impact x Confidence x Ease) x Reach)
Normalizes the Score by dividing the final score by 10
Why it works:
ICE-R is ideal for growth teams who operate across the whole funnel and want to balance learning velocity with business impact. It forces a conversation around who is affected by the test, not just what happens if it works.
Pro tip: If you’re experimenting across both B2B and B2C audiences, ICE-R helps surface tests that might have significant downstream effects on volume (B2C) or deal quality (B2B), even if they seem small on paper.
Download My Notion Experiment & Hypothesis Library Tracker (FREE)
PXL Framework:
Initially developed by ConversionXL, the PXL Framework is designed to bring more objectivity and learning potential into how teams prioritize experiments. Unlike ICE, RICE or ICE-R, which rely on relatively subjective scoring across 3–4 broad categories, PXL introduces a structured set of binary questions and weighted criteria to reduce personal bias in decision-making.
Each idea is scored across a checklist of questions such as:
- Is the change above the fold?
- Does it affect a high-traffic page?
- Is the hypothesis based on a known user behavior or feedback?
- Will this experiment potentially produce learning regardless of the outcome?
Each question carries a point value based on its historical impact. Teams assign 1 or 0 based on whether the condition applies, and the framework calculates a total score. You can then sort ideas objectively, favoring high-impact, high-learning, low-friction experiments without relying on gut feel.
Why it works:
PXL emphasizes learning velocity and implementation realism, not just impact or ease of use. It’s beneficial in orgs with a high test volume or multiple stakeholders, where decision bias and noisy inputs can derail prioritization.
The key isn’t which framework you choose, but that you use one consistently and treat it as a forcing function to align teams around business goals, not the loudest idea or latest executive whim.
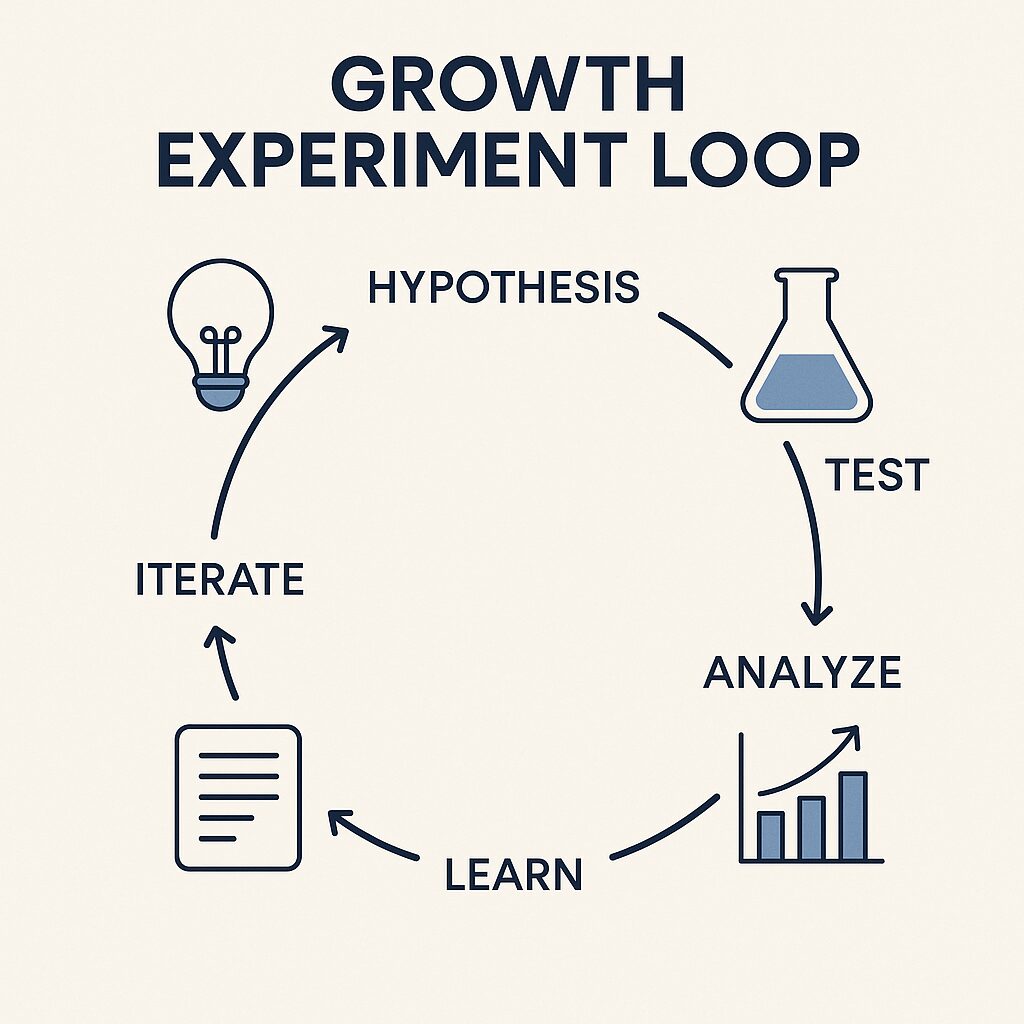
3. Rapid Iteration Cycles
Speed of learning trumps perfection of execution in growth experimentation. High-performing teams establish standardized processes that enable them to move from hypothesis to results in days or weeks, not months.
Weekly Experiment Reviews:
Teams meet weekly to review active experiments, decide on next steps, and prioritize new tests. This cadence prevents experiments from lingering indefinitely and maintains momentum.
Standardized Documentation:
Every experiment follows a standardized template that includes the hypothesis, methodology, success metrics, timeline, and responsible parties. This consistency enables faster decision-making and knowledge transfer.
Pre-Approved Testing Budgets:
Instead of requesting approval for each experiment, growth teams operate with quarterly budgets that support rapid, low-friction testing within agreed-upon guardrails. This structure empowers faster iteration and learning.
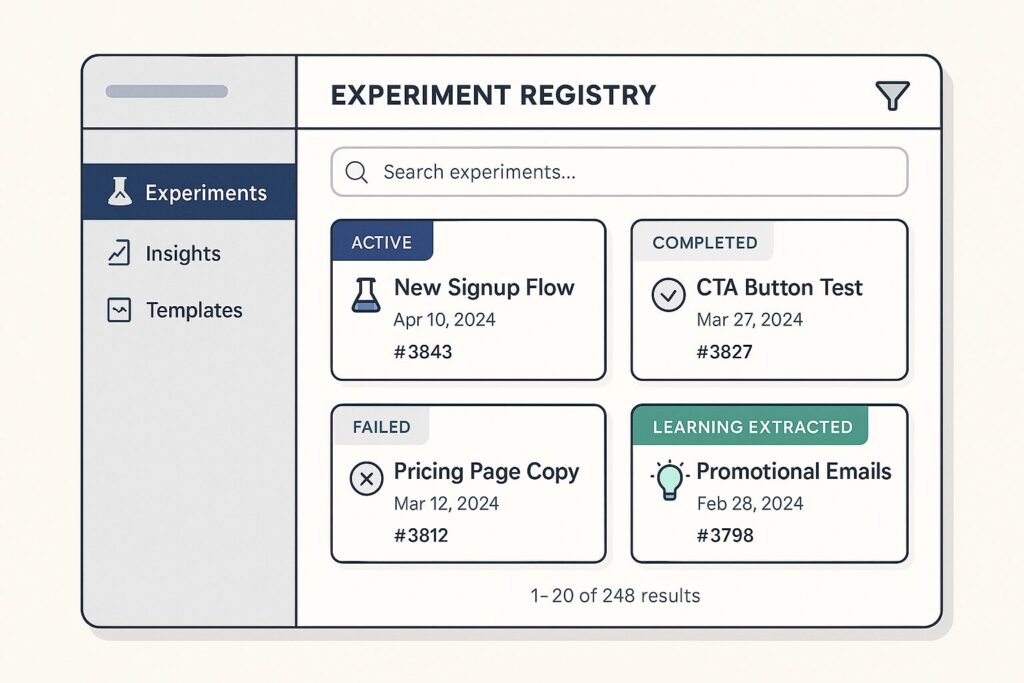
4. Centralized Tracking and Experiment Logging
Knowledge management is often the bottleneck that prevents experimentation from scaling. Teams need systems that capture not just what they test, but also what they learn and how those learnings inform future experiments.
Experiment Registry:
A centralized log of all experiments, including failed or inconclusive ones, to prevent duplicate testing and surface learnings or patterns across initiatives.
Learning Documentation:
Beyond just recording results, teams document the insights gained from each experiment and how those insights influence future testing priorities.
Cross-Team Visibility:
Experiment logs should be accessible to all relevant stakeholders, enabling both marketing and product teams to learn from each other’s experiments.
5. Post-Mortem and Learning Loop Rituals
The most valuable experiments often aren’t the ones that succeed, but the ones that fail in unexpected ways. High-performing teams institutionalize processes for extracting maximum learning from every experiment.
Experiment Retrospectives: Regular sessions where teams analyze not just what happened, but why it happened and what it means for future strategy.
Failure Celebrations: Teams that truly embrace experimentation celebrate intelligent failures as much as successes. This cultural norm encourages bold hypotheses and prevents teams from only testing “safe” ideas.
Learning Transfer: Insights from experiments should inform broader strategy, not just tactical optimizations. A failed email experiment might reveal important insights about messaging or positioning that impact product development or pricing strategy.
Want to see what this looks like in action across B2B and B2C funnels? Check out our hands-on guide to B2B and B2C growth testing strategies.
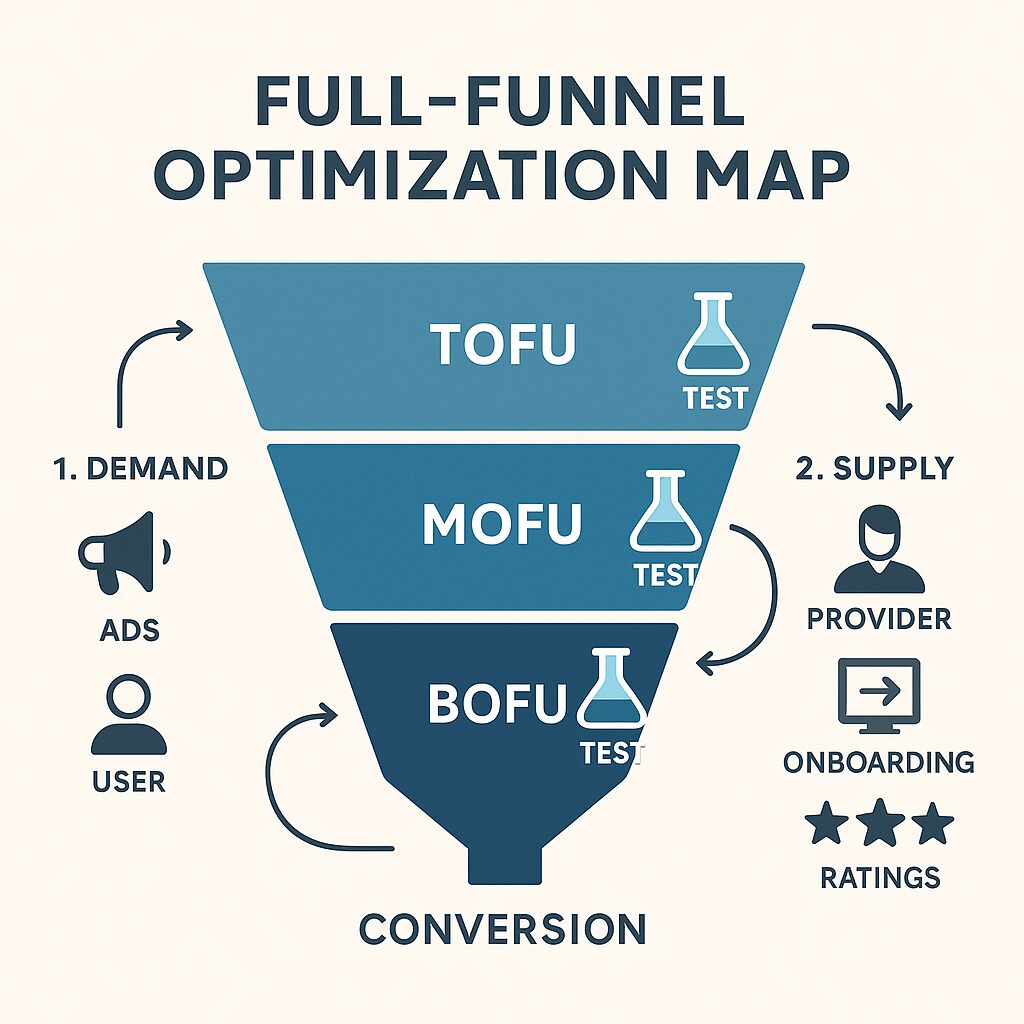
Example Framework: Full-Funnel Testing Map
To illustrate how these principles work in practice, let’s examine how a marketplace might approach full-funnel experimentation. Consider a two-sided marketplace that connects service providers with customers.
Top of Funnel (TOFU) Experiments
Demand Side Testing:
- Ad Creative Variations: Test emotional triggers in Facebook ads (fear-based messaging vs. benefit-focused messaging)
- Landing Page Headlines: Compare benefit-focused messaging (“Find Services in 24 Hours”) vs. pain-focused messaging (“Stop Dealing with Service Headaches”)
- Channel Attribution: Test different UTM parameters to understand which channels drive the highest-quality customer sign-ups
Supply Side Testing:
- Provider Acquisition Channels: Compare LinkedIn outreach, trade publication ads, and referral programs for provider acquisition
- Value Proposition Testing: Test whether providers respond better to “guaranteed work” messaging vs. “premium clients” messaging
Middle of Funnel (MOFU) Experiments
Lead Nurturing Optimization:
- Email Sequence Timing: Test 3-day vs. 7-day intervals between onboarding emails
- Content Format: Compare video tutorials vs. text-based guides for explaining platform features
- Lead Scoring Models: Test different criteria for identifying high-intent customers (service frequency, budget indicators, engagement patterns)
Trust Building:
- Social Proof Placement: Test provider reviews, customer testimonials, and completion statistics in different positions on key pages
- Verification Badges: Experiment with different types of provider credentials and how prominently to display them
Bottom of Funnel (BOFU) Experiments
Conversion Optimization:
- Service Request Flow: Test single-page vs. multi-step forms for submitting service requests
- Pricing Display: Experiment with showing estimated costs upfront vs. requiring quotes
- Provider Selection: Test automated matching vs. allowing customers to choose from multiple options
First Transaction Success:
- Onboarding Sequences: Compare immediate provider assignment vs. allowing customers to review profiles first
- Communication Tools: Test in-app messaging vs. email/phone for coordination
- Quality Assurance: Experiment with different follow-up mechanisms to ensure service completion satisfaction
This full-funnel approach ensures that optimization efforts are coordinated across the entire user journey rather than optimized in isolation.
Download My Notion Experiment & Hypothesis Library Tracker (FREE)
Tool Stack for Experimentation
The right tools can dramatically accelerate experimentation velocity, but they’re enablers of good process, not substitutes for it. Here’s how high-performing teams structure their tool stack:
Data and Analytics Tools
Google Analytics 4: Provides foundational user behavior tracking and conversion measurement. Essential for understanding baseline performance before experimentation.
Mixpanel or Amplitude: Event-based analytics platforms that enable more sophisticated funnel analysis and user segmentation. Critical for marketplace businesses that need to track different user types separately.
Looker or Tableau: Data visualization tools that make experiment results accessible to non-technical stakeholders. Enable faster decision-making by democratizing data access.
Testing Platforms
Optimizely: Enterprise-grade A/B testing platform with advanced targeting and personalization capabilities. Best for teams running complex, multi-variant experiments.
Google Optimize: A free testing platform that integrates seamlessly with Google Analytics. Sufficient for most testing needs and ideal for budget-conscious teams.
VWO: Conversion optimization platform that combines testing with heat mapping and user session recording. Valuable for understanding the “why” behind test results.
Workflow and Project Management
Airtable: Many growth teams use Airtable as their experiment registry, combining database functionality with project management features.
Notion: All-in-one workspace that can serve as an experiment documentation hub, combining wikis, databases, and project tracking.
Webflow: For teams that need to prototype and test landing pages without engineering resources rapidly.
AI-Powered Enhancement Tools
ChatGPT for Ideation: Utilize AI to generate experiment hypotheses informed by industry best practices and your unique context. Provide your current metrics and goals to receive tailored suggestions.
Claude for Experiment Scoring: Input experiment ideas and ask Claude to score them using your chosen prioritization framework. AI can help identify potential blind spots in your analysis.
Copy.ai or Jasper: Generate variations for ad copy, email subject lines, and landing page headlines at scale, enabling more comprehensive testing of messaging variations.
The key is choosing tools that integrate well together and match your team’s technical capabilities. Over-engineered tool stacks often create more friction than they solve.
Implementation Checklist: Building Your Growth Lab
If You’re Starting From Scratch
Week 1-2: Foundation Setting
- Define your primary growth metric and how it maps to business outcomes
- Audit your current data collection and identify gaps in tracking
- Choose your initial tool stack based on budget and technical resources
- Create your experiment documentation template
Week 3-4: First Experiments
- Generate an initial experiment backlog using the ICE framework
- Launch 2-3 simple experiments to test your process
- Establish weekly experiment review meetings
- Create shared access to experiment documentation for all stakeholders
Month 2: Process Refinement
- Analyze results from initial experiments and document learnings
- Refine your prioritization framework based on early results
- Expand experiment capacity as the team gains Confidence
- Begin testing across multiple funnel stages simultaneously
Baking Testing Into Weekly Rituals
Monday: Experiment Planning
- Review the previous week’s results
- Prioritize new experiments for the week
- Assign owners and deadlines for active experiments
Wednesday: Progress Check-ins
- Review any experiments reaching statistical significance
- Troubleshoot any implementation issues
- Adjust timelines if needed
Friday: Results Analysis
- Deep dive into completed experiments
- Document learnings and implications for future tests
- Celebrate wins and intelligent failures equally
Sample OKRs for Testing Teams
Objective: Integrate experimentation into the organizational DNA.
Key Results:
- Launch 40 experiments per quarter across all funnel stages
- Achieve a 70% statistical significance rate on completed experiments
- Generate a 15% improvement in the primary growth metric through testing
- Document 100% of experiments with a standardized learning template
Objective: Accelerate learning velocity.
Key Results:
- Reduce average experiment duration from 4 weeks to 2 weeks
- Increase the experiment success rate from 20% to 35% through better hypotheses
- Launch experiments across five different channels/touchpoints per quarter
- Train 100% of the growth team members on statistical significance and experimental design
The Compounding Power of Systematic Experimentation
Organizations that master growth experimentation don’t just optimize individual tactics; they also optimize the overall strategy. They build institutional learning that compounds over time. Each experiment teaches them something about their customers, their market, or their product that informs dozens of future decisions.
The teams that will dominate the next decade won’t necessarily be those with the best initial strategies, but those with the fastest learning loops. They’ll adapt more quickly to changing market conditions, identify opportunities their competitors miss, and build sustainable competitive advantages through accumulated insights.
Your growth experimentation playbook isn’t just a methodology; it’s a comprehensive approach to growth experimentation. It’s your organization’s learning system. The question isn’t whether you can afford to invest in systematic experimentation, but whether you can afford not to.
Ready to implement these frameworks? Download our free Notion Experiment & Hypothesis Library Tracker to get started immediately. Your future self will thank you for building these capabilities today rather than waiting for the “perfect” moment that never comes.
The best time to start was yesterday. The second-best time is now.
References
[1] DeBruin, J. The Growth Experiment Management System that Tripled Our Testing Velocity. https://www.reforge.com/blog/growth-experiment-management-system
[2] Amatriain, X. (2012). Netflix Recommendations: Beyond the five stars (Part 2). Netflix Tech Blog. https://netflixtechblog.com/netflix-recommendations-beyond-the-5-stars-part-2-d9b96aa399f5
[3] LearningLoop. How do we prioritize projects using the RICE scoring model? https://learningloop.io/glossary/rice-scoring-model
[4] Andreessen Horowitz. (2020). Speed as a habit: Why faster teams win. https://a16z.com/marc-andreessen-on-productivity-scheduling-reading-habits-work-and-more/
Related Articles
The Best B2B vs B2C Testing Strategies for 2025
The Ultimate B2C Growth Metrics Guide to Explode Your Revenue
B2C Brand Health Metrics Guide: Unlock Growth Now
How to Create a Winning Data-Driven Sales Strategy
Proven B2B Outreach Strategy That Gets Real Results
B2B Metric Frameworks Infographics: Unlock Growth & Profits Now
About the Author
I write about:
- AI + MarTech Automation
- AI Strategy
- COO Ops & Systems
- Growth Strategy (B2B & B2C)
- Infographic
- Leadership & Team Building
- Personal Journey
- Revenue Operations (RevOps)
- Sales Strategy
- SEO & Digital Marketing
- Strategic Thinking
📩 Want 1:1 strategic support?
🔗 Connect with me on LinkedIn
📬 Read my playbooks on Substack
Leave a Reply