Improve LTV and CAC: The Unit Economics System That Actually Builds Enterprise Value
Revenue is seductive.
It rises. Screenshots look strong. Holidays spike. The team celebrates.
And underneath it, unit economics quietly drift.
If you want to improve LTV and CAC, you are not fixing marketing. You are fixing the business’s economic architecture.
Lia’s Flowers, a local florist serving West Hills, CA and surrounding neighborhoods, makes this clear. Real inventory. Real spoilage risk. Real ad spend during Valentine’s and Mother’s Day. No margin for sloppy math.
The numbers either work.
Or they don’t.
What Most Operators Get Wrong About LTV and CAC
Most operators treat LTV and CAC as reporting metrics. They look at them after the quarter closes, nod, and move on.
That is the mistake.
LTV and CAC are not scorecards. They are operating levers. When you manage them in real time, they tell you exactly where your growth engine is breaking.
The second mistake is measuring LTV as revenue instead of gross profit. Revenue flatters. Gross profit reveals. A customer who buys $500 worth of flowers on a 20% margin contributes $100 in lifetime value. A customer who buys $200 at 55% margin contributes $110. The smaller sale is worth more.
The third mistake is treating CAC as a fixed cost rather than a targeting signal. Broad campaigns attract one-time buyers. Precision targeting attracts repeat customers. The economics are not the same.
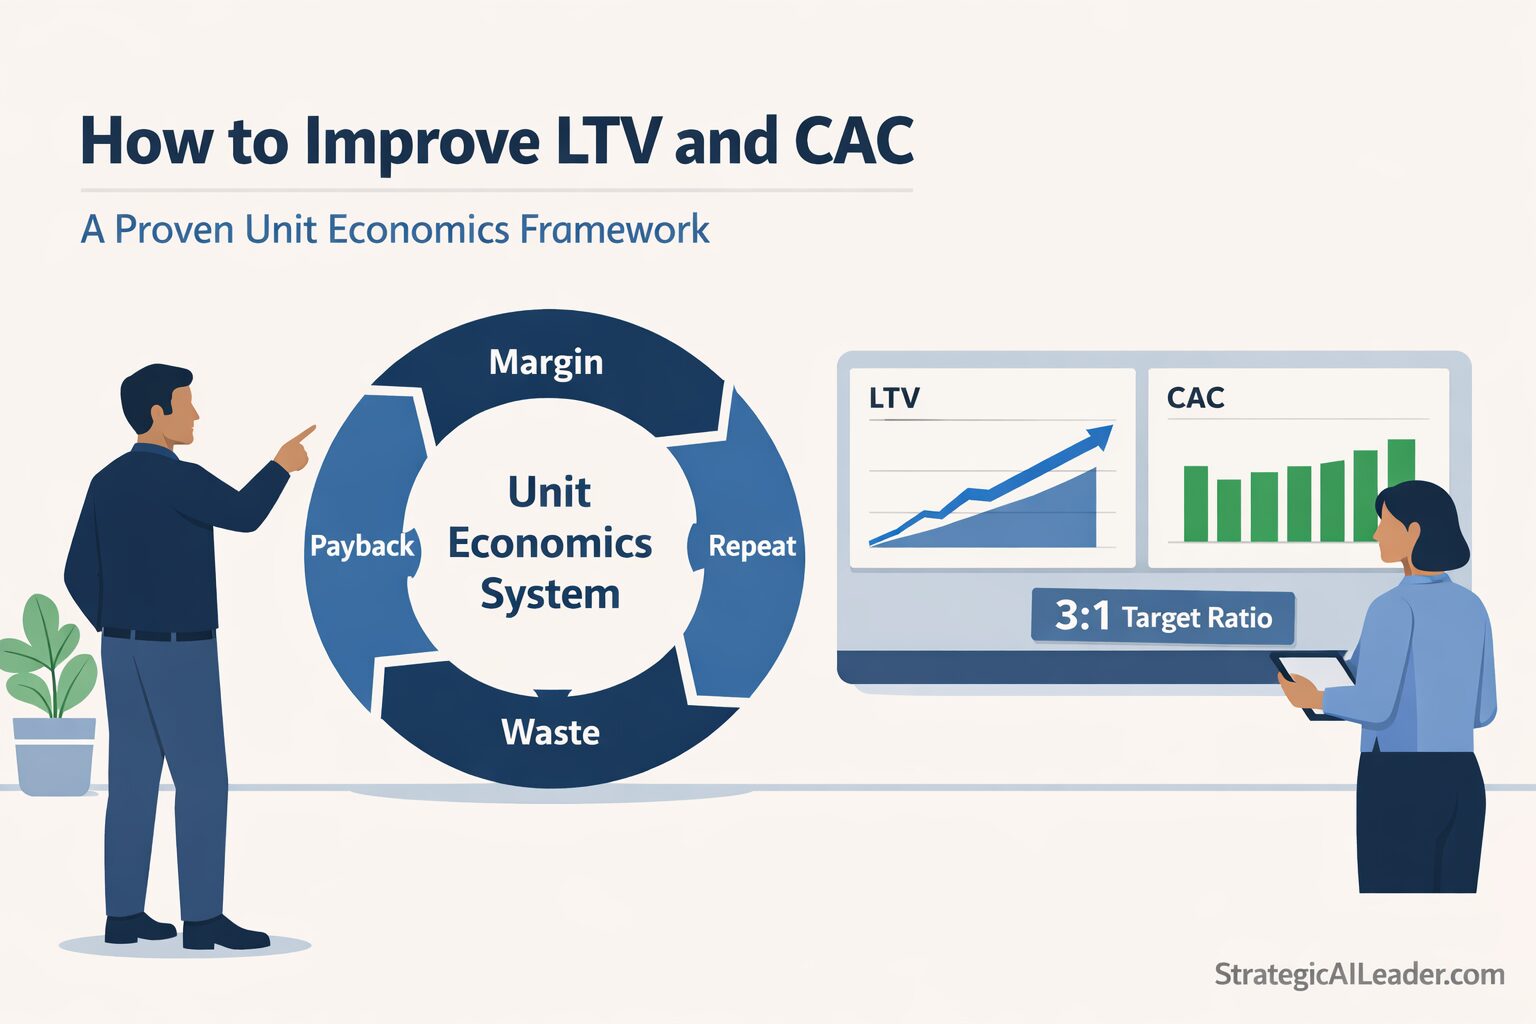
The mindset shift: stop measuring LTV and CAC separately. Manage them as a ratio, and manage that ratio as a system.
The Local Unit Economics Loop
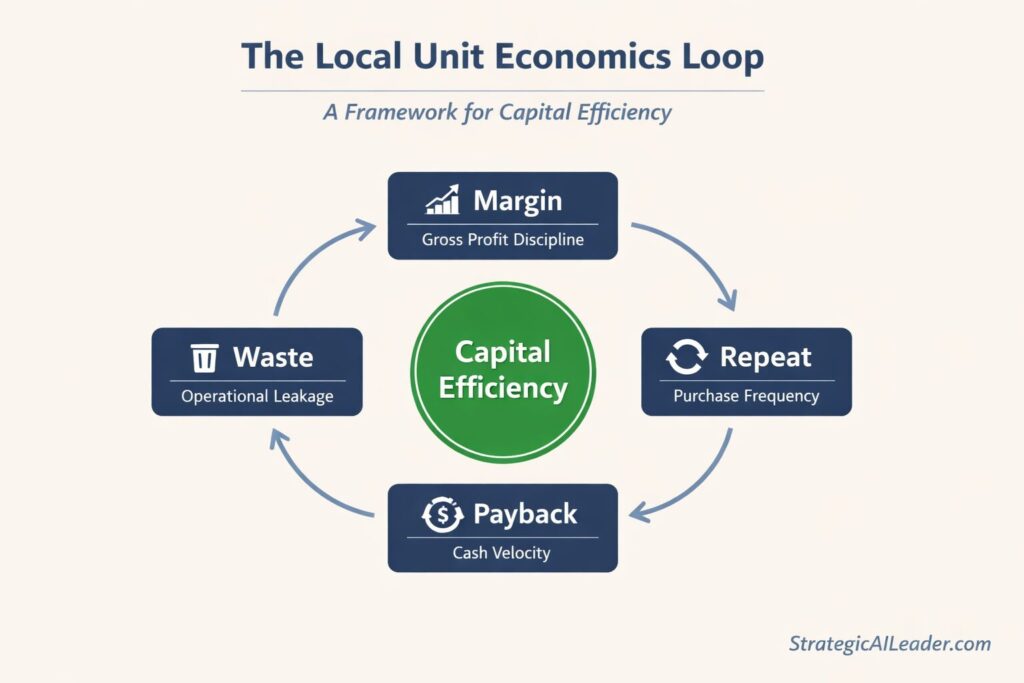
and Payback operate as one unified operating system that drives capital efficiency and sustainable growth.
Instead of chasing tactics, I prefer systems.
For a local retail business, growth depends on what I call the Local Unit Economics Loop:
- Margin Discipline
- Repeat Purchase Frequency
- Waste Reduction
- Time-to-Second Purchase Compression
Each element strengthens LTV. Together, they stabilize CAC.
But before the framework, let’s ground the math.
What Is LTV?
Customer Lifetime Value (LTV) measures the total gross profit you expect to earn from a customer over the entire relationship.
Here is the practical formula:
LTV = Average Order Value × Purchase Frequency × Gross Margin × Customer Lifespan
In a simplified retail model:
LTV = Average Order Value × Annual Purchase Frequency × Gross Margin
Example from a Lia’s Flowers Business:
- Average Order Value: $85
- Gross Margin: 55%
- Gross Profit per Order: ~$46.75
If the average customer buys once per year, the Annual LTV ≈ is $46.75. That barely offsets a $40 Customer Acquisition Cost.
Change frequency from 1 purchase to 3 purchases per year, and Annual Gross Profit ≈ $140+. Same CAC. Entirely different economics.
Improving LTV is not about clever copy. It is about changing behavior.
What Is CAC?
Customer Acquisition Cost (CAC) is the total sales and marketing spend divided by new customers acquired.
CAC = Total Sales and Marketing Spend ÷ New Customers Acquired
If Lia’s Flowers spends $4,000 on ads and acquires 100 new customers: CAC = $40.
CAC by itself tells you nothing. CAC only makes sense relative to LTV.
What Is a Healthy LTV to CAC Ratio?
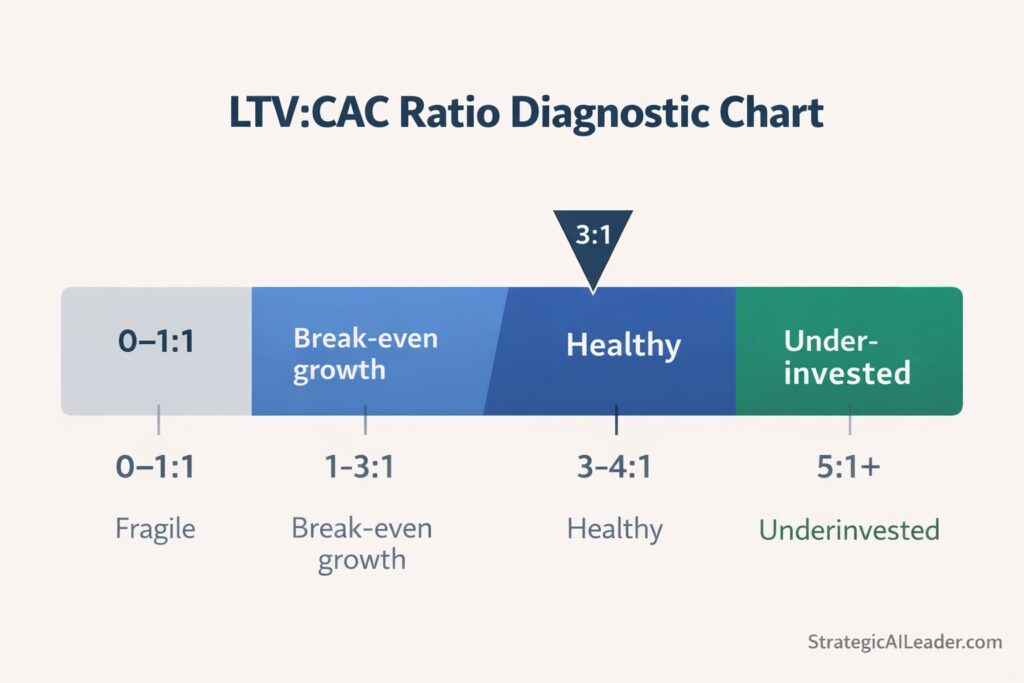
Below that is fragile. Above 5:1 may signal underinvestment.
Most sustainable growth businesses target:
- 3:1 minimum viable ratio
- 4:1 strong operating efficiency
- A ratio above 5:1 may signal underinvestment in growth.
In the florist example with LTV ≈ $47 and CAC ≈ $40, that is barely 1.2:1. That is not growth. That is exposure.
Move LTV to $140+, and the ratio becomes 3.5:1. Now growth compounds instead of straining cash flow.
And the data backs this up. Bain & Company research shows that a 5% increase in customer retention can boost profits by 25% to 95%. Repeat behavior is not a nice-to-have. It is the unit economics engine.
1. Margin Discipline
Inventory waste destroys LTV.
If gross margin slips from 55% to 48%, your LTV collapses before you notice it.
McKinsey research on AI demand forecasting shows that AI-driven forecasting can reduce supply chain errors by 20 to 50%, leading to a 65% boost in efficiency through fewer lost sales. For perishable inventory businesses like florists, that improvement alone expands gross profit per order.
Higher gross profit raises LTV without requiring new customers.
Recruiters evaluating growth leaders look for gross margin expansion. It signals operational control, not surface growth.
2. Repeat Purchase Frequency
Acquiring a Valentine’s Day order is not a success.
Turning that customer into a Mother’s Day purchase, an anniversary reminder, a sympathy arrangement, and a corporate gifting account is success.
Repeat purchase rate is the single most under-measured driver of LTV in local businesses.
For more on how repeat behavior drives sustainable metrics, see my guide on B2C growth metrics and LTV optimization.
3. Waste Reduction
Waste is a negative margin hiding in plain sight.
If 20% of inventory becomes unusable, effective LTV declines even if revenue grows.
Reducing waste by 20% does more for LTV than trimming CAC by 10%. That is operational leverage.
Operators who understand this focus on contribution margin rather than just revenue.
4. Time to Second Purchase
Few businesses measure this: days to second transaction.
If repeat purchases occur 11 months later, the payback period stretches. Cash flow tightens. Growth feels stressful.
If AI models predict reorder timing and compress the window to 90 days, LTV materializes faster.
A shorter payback period means improved capital efficiency, lower working capital requirements, and a stronger cash conversion cycle.
For a deeper breakdown of how payback period and CAC interact at the leadership level, read the Ultimate B2B Revenue Metrics Guide for COOs.
CAC Is a Targeting Signal, Not a Fixed Cost
CAC does not rise randomly.
Broad targeting attracts one-time buyers. High intent segmentation attracts repeat customers. Targeting new homeowners, engagement ring buyers, corporate administrators, and school parent communities improves customer quality. Higher quality improves retention rate. Retention improves LTV. LTV stabilizes CAC.
This is not campaign optimization. It is a segment design.
The acquisition cost math changes completely when you target customers who are structurally likely to repeat. Harvard Business Review reports that acquiring a new customer costs 5 to 25 times as much as retaining an existing one. That gap is why segment precision is a financial decision, not a marketing one.
Before and After: The Local Unit Economics Loop in Practice
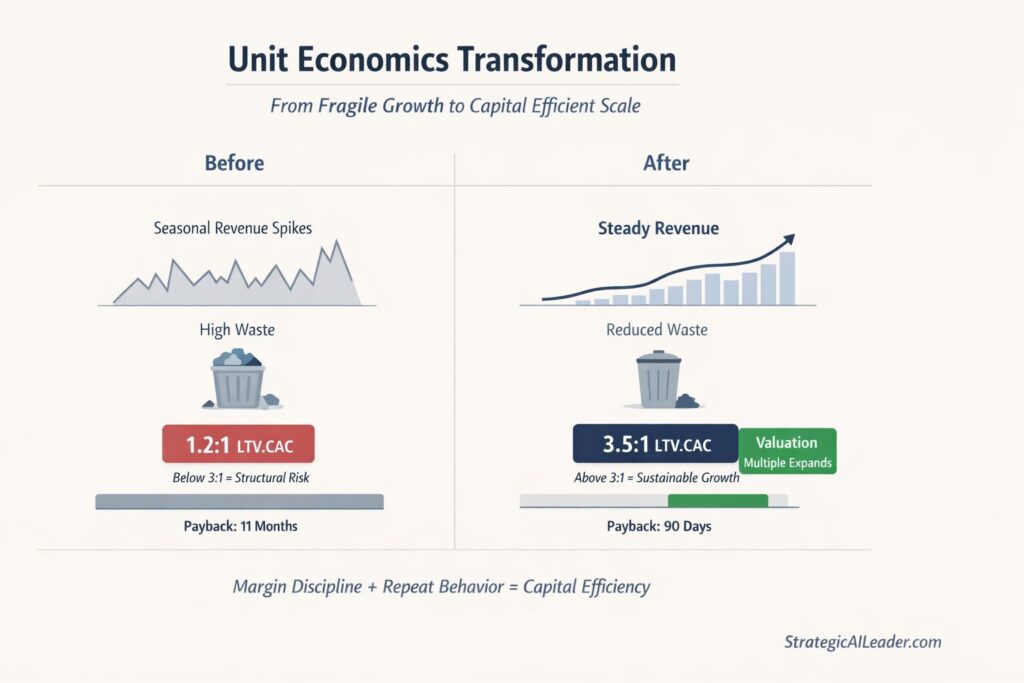
and compressing payback transforms fragile growth into capital-efficient scale.
Before: Seasonal revenue spikes, rising ad costs, no cohort profitability tracking, inventory waste reducing margin, payback dependent on first purchase.
After implementing the Local Unit Economics Loop:
- 20% waste reduction from AI demand forecasting
- Structured repeat purchase automation
- Subscription and corporate gifting offerings
- 90-day cohort tracking replacing annual snapshots
- LTV:CAC ratio above 3:1
Revenue becomes steadier. Margins expand. Payback compresses. Forecasting improves. Growth becomes controlled rather than hopeful.
Quick Wins: Apply This Week
- Calculate your actual LTV today. Use gross profit, not revenue. If you do not know your gross margin by customer segment, that is the first fix.
- Pull your LTV:CAC ratio. If it is below 3:1, you have a structural problem, not a marketing problem.
- Audit repeat purchase rate. What percentage of Valentine’s Day customers bought again within 90 days? That number tells you more than monthly revenue.
- Identify your highest-margin customer segments. Stop spending to acquire customers who will never generate a 3:1 return.
- Start measuring the time to the second purchase. If you cannot answer this in 60 seconds, you are flying blind on the payback period.
- Add one automated reorder trigger. A birthday reminder, a seasonal prompt, a loyalty follow-up. One trigger. Measure the lift.
Why This Matters Beyond Florists
Replace flowers with software. Replace repeat bouquet purchases with subscription renewals. Replace waste with infrastructure inefficiency.
The system is the same.
Improve LTV. Stabilize CAC. Compress payback. Expand margin.
Enterprise value rises when risk declines. Revenue growth without margin discipline inflates valuation risk. Structured unit economics increase the valuation multiple.
Frequently Asked Questions
How do you improve LTV and CAC at the same time?
You improve LTV and CAC by managing them as one system. Increase gross profit per customer through repeat purchase behavior. Protect gross margin through waste reduction. Shorten the time to the second purchase. Tighten targeting so acquisition spend attracts customers who are structurally likely to repeat. When LTV rises and payback compresses, CAC becomes more sustainable.
What is LTV and how do you calculate it for a local business?
Customer Lifetime Value, or LTV, measures the total gross profit expected from a customer over the relationship.
A practical retail formula is:
LTV = Average Order Value × Annual Purchase Frequency × Gross Margin
Always use gross profit, not revenue. Revenue flatters. Gross profit tells the truth.
What is CAC and how do you calculate it?
Customer Acquisition Cost, or CAC, equals total sales and marketing spend divided by new customers acquired.
CAC = Total Sales and Marketing Spend ÷ New Customers Acquired
CAC only matters relative to LTV. By itself, it tells you nothing about sustainability.
What is a healthy LTV to CAC ratio?
A common benchmark for sustainable growth is a 3:1 LTV to CAC ratio. Around 4:1 signals strong operating efficiency. Above 5:1 may indicate underinvestment in growth depending on your expansion goals.
Anything below 3:1 is fragile.
Why should LTV be measured as gross profit instead of revenue?
Revenue hides cost structure. Gross profit shows how much capital is available to cover acquisition, operations, and overhead.
A customer who spends more revenue can still produce less lifetime value if margins are lower.
How can a florist increase LTV without offering discounts?
Increase repeat purchase frequency. Capture key dates. Trigger automated reminders. Introduce subscription bouquets. Build corporate gifting accounts. Measure and shorten the time between the first and second purchase.
Behavior change drives LTV, not discounting.
How does inventory waste impact LTV and CAC?
Inventory waste reduces gross margin. Lower margin reduces LTV. Lower LTV makes the same CAC riskier.
Reducing waste increases gross profit per order and lifts LTV without increasing acquisition spend.
What is time to second purchase and why does it matter?
Time to second purchase measures the days between the first and second transaction.
A shorter gap improves payback period, capital efficiency, and cash flow stability. It reduces reliance on constant new customer acquisition.
Key Takeaways
- LTV measures lifetime gross profit, not revenue.
- CAC must be evaluated relative to LTV. Below 3:1 is fragile.
- Margin expansion often improves LTV faster than lowering CAC.
- Repeat purchase frequency drives durable, compounding growth.
- Time-to-second purchase determines the speed of payback and capital efficiency.
- Recruiters evaluate contribution margin, retention, and capital efficiency, not vanity traffic metrics.
Final Thought
Small businesses do not struggle from a lack of effort.
They struggle with fragile economies hidden beneath rising revenue.
Improving LTV and CAC is not a marketing tweak.
It is economic engineering.
And the operators who understand that build businesses that last.
Help Support My Writing
Subscribe for weekly articles on leadership, growth, SEO and AI-driven strategy. You’ll receive practical frameworks and clear takeaways that you can apply immediately. Connect with me on LinkedIn or Substack for conversations, resources, and real-world examples that help.
Related Articles
SEO Strategy for ROI: A Better Way to Win Big
Growth Loop Strategy: Best Practices for Business Leaders
ROI Growth Experiments: The Data-Driven Way to Win
The Best B2B vs B2C Testing Strategies for 2025
The Ultimate B2C Growth Metrics Guide to Explode Your Revenue
B2C Brand Health Metrics Guide: Unlock Growth Now
How to Create a Winning Data-Driven Sales Strategy
Proven B2B Outreach Strategy That Gets Real Results
B2B Metric Frameworks Infographics: Unlock Growth & Profits Now
The Truth About AI-Driven SEO Most Pros Miss
Intent-Driven SEO: The Future of Scalable Growth
About the Author
I’m Richard Naimy, an operator and product leader with over 20 years of experience growing platforms like Realtor.com and MyEListing.com. I work with founders and operating teams to solve complex problems at the intersection of product, marketing, AI, systems, and scale. I write to share real-world lessons from inside fast-moving organizations, offering practical strategies that help ambitious leaders build smarter and lead with confidence.
I write about:
- AI + MarTech Automation
- AI Strategy
- COO Ops & Systems
- Growth Strategy (B2B & B2C)
- Infographic
- Leadership & Team Building
- My Case Studies
- Personal Journey
- Revenue Operations (RevOps)
- Sales Strategy
- SEO & Digital Marketing
- Strategic Thinking
Want 1:1 strategic support?
Connect with me on LinkedIn
Read my playbooks on Substack
Leave a Reply