Table of Contents
- Executive Summary: The Best B2B vs B2C Testing Strategies for 2025
- What Most Leaders Get Wrong About Growth Experiments
- The Growth Lab Framework: A B2B & B2C Testing Strategy System That Scales
- Section 1: B2B Testing Strategy – The Enterprise Playbook
- Section 2: B2C Testing Strategies – The Consumer Playbook
- Quick Wins & Practical Tips for Both B2B and B2C
- Universal Growth Experiment Starters
- Measuring What Matters: The Growth Lab Dashboard
- The Future of Growth Experimentation
- Your Growth Lab Action Plan
- Conclusion: From Experimentation to Growth Acceleration
- B2B Testing Strategies FAQs
- 1. How long should B2B growth experiments typically run?
- 2. What's the ideal sample size for B2B growth experiments?
- 3. How do you handle seasonality in B2B growth experiments?
- 4. Should B2B experiments focus on quantity or quality of leads?
- 5. How do you get buy-in from sales teams for growth experiments?
- 6. What's the biggest mistake B2B companies make with growth experiments?
- 7. How do you measure the ROI of B2B growth experiments?
- 8. Should different personas have different growth experiment approaches?
- 9. How do you handle growth experiments with enterprise clients?
- 10. What tools are essential for B2B Testing Strategies?
- B2C Testing Strategies FAQs
- 1. How quickly can you see results from B2C growth experiments?
- 2. What's the minimum traffic needed for B2C growth experiments?
- 3. How do you prioritize growth experiments with limited resources?
- 4. Should mobile and desktop be tested separately?
- 5. How do you handle growth experiments during app store review periods?
- 6. What's the role of personalization in B2C growth experiments?
- 7. How do you measure the impact of viral growth experiments?
- 8. Should you test price changes as growth experiments?
- 9. How do you handle growth experiments that might hurt user experience?
- 10. What's the best way to learn from failed B2C growth experiments?
Executive Summary: The Best B2B vs B2C Testing Strategies for 2025
In a world flooded with A/B tests and feature toggles, most companies aren’t suffering from a lack of experimentation — they’re drowning in low-impact ones.
This article introduces the Growth Lab Approach, a high-leverage experimentation system designed to drive compounding growth across both B2B and B2C models. By integrating strategic prioritization (via the ICE-R Scoring Model), cross-functional collaboration, and AI-assisted forecasting, experimentation is reframed from random testing to a repeatable operating system.
Readers will discover:
- Why learning velocity beats test volume
- How to build a balanced 70-20-10 experiment portfolio
- Where most teams fail (spoiler: onboarding and handoff)
- The Core Four Metrics every growth leader should track
- Real-world case studies of successful B2B and B2C experiments
With visual frameworks, mock dashboards, and step-by-step guidance, this guide transforms experimentation into a strategic growth asset, rather than a chaotic guessing game.
Perfect for CMOs, product leaders, COOs, and growth strategists looking to scale smart.
Picture this: you’re sitting in yet another quarterly review meeting, staring at flat growth numbers while your competitors seem to be pulling ahead. Sound familiar? Here’s the thing most leaders get wrong about growth experimentation – they treat it like throwing spaghetti at the wall instead of running a systematic growth lab.
I learned this the hard way when I was leading growth at Realtor.com. We were running experiment after experiment, but our growth stayed stubbornly flat. That’s when I had a revelation – we weren’t running experiments, we were making educated guesses with fancy names. That’s when the Growth Lab Approach was born: a repeatable, systematic framework for testing what matters, not just what’s easy. This realization transformed our approach from a guess-based system to a data-driven operating system.
Real B2B & B2C testing strategies aren’t about running more tests. It’s about running the proper tests with a framework that moves the needle. Today, I’m sharing the Growth Lab approach that transformed how I think about B2B and B2C growth strategy.
What Most Leaders Get Wrong About Growth Experiments
Let me tell you about my biggest rookie mistake. Ten years ago, I inherited a growth team that was proud of running 15 experiments per quarter. Impressive, right? Wrong. We achieved a 2% win rate and had no impact on our key north star metric, which is the single metric that best captures the core value that your product delivers to customers and drives your company’s growth.
The problem? We were playing small ball. Instead of asking ‘What could 10x our growth?’ we were asking ‘What button color might increase clicks by 3%?’ We were optimizing for activity, not outcomes. But here’s the mindset shift that changed everything: High-leverage experiments focus on systems, not tactics. This shift in mindset inspired us to aim higher and focus on the bigger picture of growth.
Here’s the mindset shift that changed everything: High-leverage experiments focus on systems, not tactics.
Most growth experiments fail because they attempt to optimize individual touchpoints rather than entire growth loops. It’s like trying to fix a leaky pipe by polishing the faucet – you’re working on the wrong part of the system.
The Growth Lab approach treats experimentation like running a research facility, not a casino. Every experiment builds on the last, creating a compound learning effect that accelerates growth over time. This emphasis on compound learning effect reassured us that even ‘failed’ experiments contribute to our growth journey.
The Growth Lab Framework: A B2B & B2C Testing Strategy System That Scales
After analyzing over 200 growth experiments across B2B and B2C companies, I’ve distilled the most effective approach into four core principles:
1. The ICE-R Scoring System
Traditional ICE scoring (Impact, Confidence, Ease) misses a crucial element: Reach. Here’s how I evaluate every potential experiment:
- Impact: Will this move our north star metric by 10% or more if successful?
- Confidence: Based on data and research, how likely is this to work?
- Ease: Can we execute this with our current resources?
- Reach: How many users/customers will this affect?
Score each factor from 1 to 10, then multiply the scores together. Only experiments scoring 100 or more make it to our sprint planning.
| Test | Impact | Confidence | Ease | Reach | ICE-R Score | Priority |
|---|---|---|---|---|---|---|
| Test 1 | 7 | 1 | 5 | 8 | 280 | Medium |
| Test 2 | 8 | 2 | 3 | 7 | 336 | High |
| Test 3 | 6 | 6 | 5 | 2 | 360 | High |
ICE-R Formula: (Impact * Confidence * Ease * Reach) / 4
Key Insight: Although Test 1 appears appealing (high Impact and Reach), its low Confidence skews the outcome. Test 3, with balanced inputs, yields the highest score, helping teams focus on what’s truly worth testing.
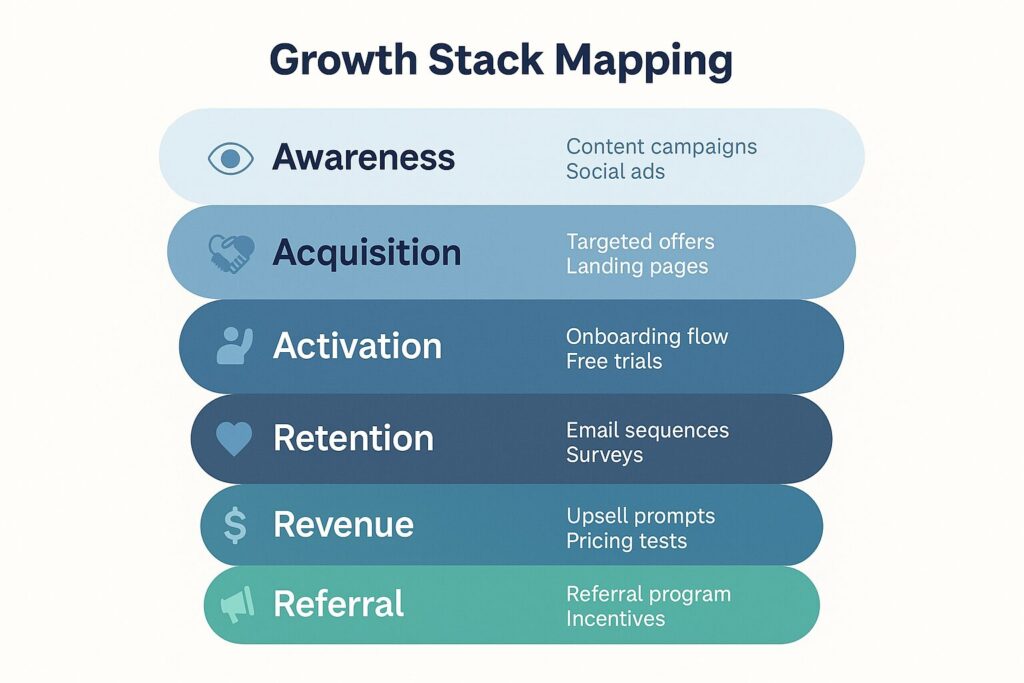
2. The Growth Stack Mapping
Before running any experiment, map your entire growth stack:
Awareness → Acquisition → Activation → Retention → Revenue → Referral
Most failed experiments happen because teams optimize one stage while accidentally breaking another. I once watched a company boost sign-ups by 40% through a growth experiment – only to watch their activation rate tank because new users weren’t properly onboarded.
3. The 70-20-10 Experiment Portfolio
This approach borrows from Google’s innovation model, retooled for growth:
- 70% of experiments focus on optimizing existing growth loops
- 20% test new channels or significant improvements
- 10% are moonshot experiments that could change everything
This portfolio approach ensures that you’re building on proven foundations while still taking calculated risks.
4. The Learning Velocity Metric
Stop measuring experiments by win rate. Start measuring by learning velocity – how quickly you’re gaining insights that compound into bigger wins.
Track: Learning Velocity = (Number of Insights × Impact Score) / Time to Result
This metric rewards teams for running experiments that teach you something meaningful, even when they “fail.”
| Aspect | B2B Test Strategy | B2C Test Strategy |
|---|---|---|
| Sales Cycle | Long, multi-stakeholder | Short, individual-led |
| Experiment Velocity | Slower, higher stakes | Fast, volume-driven |
| Metrics of Success | Pipeline, ACV, NRR | DAU/MAU, LTV, Retention |
| Typical Growth Loops | Content, Virality, Partnerships | Referral, Social Sharing, Gamified |
| Key Challenges | Alignment, data quality, buy-in | Noise, retention, churn |
Section 1: B2B Testing Strategy – The Enterprise Playbook
B2B testing strategies require an entirely different approach from B2C. You’re dealing with longer sales cycles, multiple decision-makers, and higher stakes. Here’s how to adapt the Growth Lab framework for B2B success.
The B2B Experiment Hierarchy
Level 1: Product-Led Growth Experiments.
These focus on reducing friction in your product experience. According to research from Kameleoon’s 2024 Experimentation & Growth Survey, businesses with well-aligned product-led and marketing-led growth strategies are 81% more likely to grow significantly in 2025.
High-leverage experiment example: Test whether offering a “sandbox environment” during your free trial increases trial-to-paid conversion. One B2B software company I assisted saw a 34% increase in conversions by allowing prospects to interact with dummy data, rather than requiring them to upload their files.
Level 2: Sales Process Optimization.
These experiments focus on your sales funnel and process efficiency. Research from VWO’s 2025 Conversion Rate Optimization Statistics reveals that the average conversion rate in B2B e-commerce is 1.8%, underscoring the importance of systematic experimentation to surpass industry benchmarks.
High-leverage experiment example: Test whether scheduling discovery calls within 5 minutes of form submission (vs. within 24 hours) increases show-up rates and close rates. A client of mine increased their SQL-to-opportunity conversion by 28% with this simple timing change.
Level 3: Account-Based Marketing (ABM) Experiments.
These target specific high-value accounts with personalized experiences. Data from First Page Sage’s 2025 B2B Conversion Rate Study reveals that even top-performing companies, such as Salesforce, convert less than 5% of their traffic into qualified leads, demonstrating the competitive advantage of practical experimentation.
High-leverage experiment example: Create personalized landing pages for your top 50 target accounts, featuring their company name, industry-specific case studies, and tailored value propositions. One enterprise software company saw a 156% increase in demo requests from target accounts using this approach.
B2B Growth Loops to Experiment With
The Content Flywheel Loop:
Expert content → SEO traffic → Email captures → Nurture sequence → Sales qualified leads → Customer success stories → More expert content
Experiment: Test whether gating your best content behind email capture increases or decreases your overall pipeline contribution. Many B2B companies are surprised to find that ungated content drives more qualified leads through increased trust and shareability.
The Product Virality Loop:
User invites teammates → Teams collaborate better → Success drives expansion → More teams invited → Increased user base.
Experiment: Test whether offering account-level analytics (showing team performance) increases user invitations by 20% or more. Slack famously used this approach to drive viral growth within organizations.
The Partner Ecosystem Loop:
Partners integrate with your platform → Joint customers see value → Case studies created → More partners attracted → Expanded reach.
Experiment: Test whether co-branded content with integration partners increases both partner engagement and customer acquisition. One API company I advised increased its partner-driven revenue by 45% through systematic co-marketing experiments.
B2B Experimentation Metrics That Matter
Primary Metrics:
- Pipeline velocity (time from MQL to closed-won)
- Customer acquisition cost (CAC) by channel
- Annual contract value (ACV) trends
- Net revenue retention (NRR)
Secondary Metrics:
- Product-qualified leads (PQLs) from growth experiments
- Sales cycle length changes
- Deal win rates by experiment cohort
- Customer lifetime value (CLV) impact
B2B Growth Experiment Case Study: The Onboarding Acceleration Test
A B2B marketing automation company was struggling with a 45-day average time-to-value for new customers. Long onboarding periods were hurting renewal rates and creating bottlenecks in customer success.
Hypothesis: Reducing time-to-first-value from 45 days to 14 days would increase 12-month retention by 25%.
Experiment Design:
- Create a simplified onboarding flow focusing on one high-impact use case
- Assign dedicated onboarding specialists to new accounts
- Implement milestone-based check-ins with automated triggers
Results:
- Time-to-value dropped to 12 days (better than target)
- 12-month retention increased by 31%
- Customer satisfaction scores improved by 22%
- Reduced customer success team workload by 18%
This single experiment increased annual recurring revenue by $2.3M and became the foundation for their customer success strategy.
For deeper B2B metrics insights, read my guide: The Ultimate B2B Revenue Metrics Guide for Leaders (Part 1) & The Ultimate B2B Efficiency Metrics Playbook for Leaders (Part 2).
Section 2: B2C Testing Strategies – The Consumer Playbook
B2C testing strategies move faster and require different thinking. You’re dealing with higher volumes, lower-touch interactions, and the complexities of consumer psychology. Here’s how to adapt the Growth Lab framework for B2C success.
The B2C Experiment Velocity Model
Sprint-Based Testing:
In B2C contexts, conversion efficiency and rapid feedback loops are critical. According to Smart Insights’ 2025 update on e-commerce conversion benchmarks, average mobile conversion rates hover around 2.8%, while desktop conversion rates are approximately 3.2%, resulting in an overall rate of 2.9% (smartinsights.com). These low baseline metrics highlight why top-performing marketing teams use 2-week experiment sprints. This allows them to identify high-impact creative, messaging, or UX changes that can move needle-thin conversion curves.
By iterating rapidly and avoiding lengthy delays between tests, teams can discover incremental lifts and compound small percentage gains into meaningful user engagement and revenue growth.
Micro-Conversion Optimization:
Focus on small behavioral changes that compound into significant growth. According to Invesp’s 2024 Conversion Rate Statistics, the average website conversion rate across industries is 2.35%, indicating that minor improvements in each funnel stage can result in overall growth of 25% or more.
Behavioral Trigger Testing:
Experiment with psychological triggers, such as scarcity, social proof, and loss aversion. Research from the Journal of Consumer Psychology shows that behavioral triggers can increase conversion rates by 15-30%.
B2C Growth Loops to Experiment With
The Social Sharing Loop:
User creates content → Content gets shared → New users discover the app → They create content → More sharing.
Experiment: Test whether adding “share to unlock premium features” increases both sharing rates and user engagement. TikTok famously used sharing mechanics to drive viral growth, with users sharing content to unlock editing features.
The Referral Incentive Loop:
User refers friend → Both get rewards → Referred user becomes active → They refer more friends → Exponential growth.
Experiment: Test whether offering both referrer and referee rewards increases referral rates compared to single-sided incentives. Dropbox’s famous “space for you, space for your friend” campaign increased referrals by 60% over single-sided rewards.
The Content Consumption Loop:
User consumes content → Algorithm learns preferences → Better content recommended → Higher engagement → More data for algorithm → Better content.
Experiment: Test whether showing “content you might like” based on similar user behavior increases session length and return rates. Netflix’s recommendation engine drives 80% of viewer engagement through systematic experimentation.
B2C Testing Strategy Tactics
Onboarding Optimization Test:
Progressive onboarding vs. comprehensive setup. Many B2C apps find that showing value immediately (then collecting data progressively) increases activation rates by 25-40%.
Push Notification Experiments:
Test personalization, timing, and frequency. Research from Localytics shows that personalized push notifications have 4x higher open rates than generic messages.
Social Proof Integration:
Test different types of social proof (user counts, recent activity, testimonials) at various touchpoints. Studies show that relevant social proof can increase conversions by 15-30%.
B2C Experimentation Metrics That Matter
Primary Metrics:
- Daily/Monthly active users (DAU/MAU)
- User acquisition cost (UAC) by channel
- Lifetime value (LTV) by cohort
- Retention rates (1-day, 7-day, 30-day)
Secondary Metrics:
- Session length and frequency
- Feature adoption rates
- Share/referral rates
- In-app conversion rates
B2C Growth Experiment Case Study: The Gamification Retention Test
A fitness app was struggling with user retention – 60% of users stopped using the app after 30 days. Traditional push notifications and reminders weren’t working.
Hypothesis: Adding gamification elements (streaks, achievements, leaderboards) would increase 30-day retention by 35%.
Experiment Design:
- Create workout streaks with visual progress indicators
- Add achievement badges for milestones
- Implement friend leaderboards (opt-in)
- Test against the control group with the standard app experience
Results:
- 30-day retention increased by 42% (exceeded target)
- Session frequency increased by 28%
- Social sharing of achievements increased by 156%
- Premium subscription conversion improved by 19%
This experiment led to a complete gamification overhaul that became their primary differentiation strategy, resulting in 200% year-over-year growth.
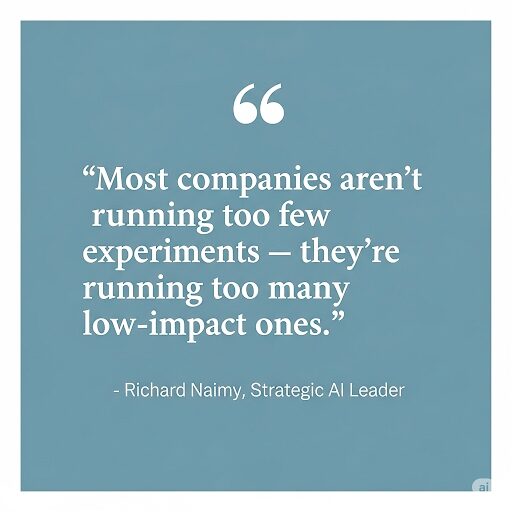
“Most companies aren’t running too few experiments – they’re running too many low-impact ones.” – Richard Naimy, Strategic AI Leader
Quick Wins & Practical Tips for Both B2B and B2C
Here are actionable tactics you can implement this week to start running high-leverage experiments:
For deeper B2C metrics insights, read my guide: The Ultimate B2C Growth Metrics Guide (Part 1) & B2C Brand Health Metrics Guide: Unlock Growth Now (Part 2)
Universal Growth Experiment Starters
1. The Email Signature Test
Add a compelling call-to-action to your team’s email signatures. Test different offers (such as free resources, consultations, and demos) and track click-through rates. One B2B company generated over 300 qualified leads per month solely from optimized email signatures.
2. The Landing Page Headline Challenge
Test 5 different headlines for your most important landing page. Use the formula: [Outcome] + [Timeframe] + [Credibility]. Example: “Increase Sales by 40% in 90 Days (Backed by 1,000+ Customer Success Stories)”
3. The Social Proof Experiment
Add customer logos, testimonials, or usage statistics to your homepage to enhance its credibility and appeal. Test placement, format, and specificity. “Join 50,000+ users” often performs better than “Join thousands of users.”
4. The Form Optimization Test
Reduce form fields by 50% and test conversion rates to optimize the user experience. Most companies find that shorter forms with progressive profiling outperform long forms by 20-40%.
5. The Urgency/Scarcity Test
Test adding legitimate urgency or scarcity elements to your offers. “Limited spots available” or “Offer expires in 48 hours” can increase conversion rates significantly when authentic.
B2B-Specific Quick Wins
1. The Demo Scheduling Optimization
Test whether offering multiple demo options (15-minute overview, 30-minute deep dive, 45-minute custom demo) increases booking rates compared to a single demo option.
2. The Case Study Targeting Test
Display industry-specific case studies relevant to the visitor’s company domain. Use tools like Clearbit to identify visitor companies and display relevant success stories.
3. The Follow-Up Sequence Test
Test whether sending educational content (instead of sales pitches) in your follow-up sequences increases response rates and meeting bookings.
B2C-Specific Quick Wins
1. The Onboarding Completion Test:
Test whether showing progress indicators during onboarding increases completion rates. Many apps see 30%+ improvement with simple progress bars.
2. The Social Login Test:
Test whether offering social login options (Google, Facebook, Apple) increases sign-up rates compared to email-only registration.
3. The Referral Timing Test
Test asks for referrals after users complete a positive action (instead of randomly) to increase referral rates and quality.
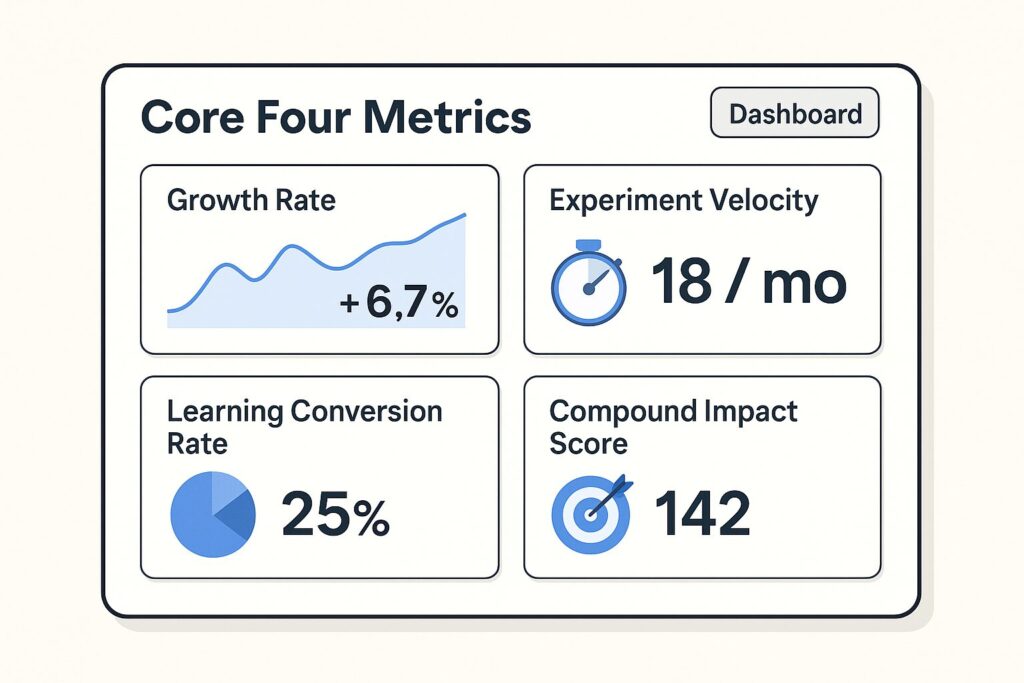
Measuring What Matters: The Growth Lab Dashboard
Stop drowning in vanity metrics. Here’s the essential dashboard for tracking growth experimentation success:
The Core Four Metrics
1. Growth Rate: Month-over-month growth in your north star metric (revenue, active users, etc.)
2. Experiment Velocity Number of high-impact experiments completed per month (aim for 8-12)
3. Learning Conversion Rate Percentage of experiments that provide actionable insights (target: 80%+)
4. Compound Impact Score: How much each experiment builds on previous learnings (measure through attribution)
Advanced Tracking
Customer Cohort Analysis: Track how different experiment cohorts perform over time. This reveals long-term impact vs. short-term wins.
Channel Attribution: Understand which experiments drive growth in which channels. Often, product improvements boost organic growth more than marketing experiments.
Retention Impact: Measure the impact of growth experiments on customer retention. Growth that hurts retention isn’t sustainable.
The Future of Growth Experimentation
The landscape of growth experimentation is evolving rapidly. Here’s what forward-thinking leaders should prepare for:
AI-Powered Experimentation
Machine learning is transforming how we design and analyze experiments. Soon, AI will help predict experiment outcomes before teams even run them.
Cross-Platform Growth Loops
The future belongs to companies that can create growth loops spanning multiple platforms and touchpoints. Think of TikTok driving traffic to Shopify stores, which then drive email list growth, which in turn informs TikTok ad targeting.
Privacy-First Growth
With increasing privacy regulations, growth experimentation must adapt to work with less data. First-party data and consent-based personalization will become crucial competitive advantages.
Your Growth Lab Action Plan
Ready to transform your approach to growth experimentation? Here’s your step-by-step action plan:
Week 1: Foundation Setup
- Audit your current experiments using the ICE-R framework
- Map your complete growth stack (awareness through referral)
- Set up proper tracking for the Core Four metrics
Week 2: Portfolio Rebalancing
- Categorize current experiments into the 70-20-10 portfolio
- Identify gaps in your experiment coverage
- Kill low-impact experiments that aren’t teaching you anything
Week 3: First High-Leverage Experiment
- Choose one high-impact experiment from this article
- Design a proper testing methodology with clear success metrics
- Launch with appropriate control groups and tracking
Week 4: Results Analysis and Iteration
- Analyze results using learning velocity metrics
- Document insights and build on learnings
- Plan the next experiment based on what you discovered
Conclusion: From Experimentation to Growth Acceleration
Here’s my contrarian take: most companies aren’t running too few experiments – they’re running too many low-impact tests. The Growth Lab approach isn’t about doing more; it’s about doing what matters.
The companies that win in the next decade won’t be the ones running the most experiments—they’ll be the ones running the right experiments inside a system that learns and compounds. This is what the Growth Lab is built for.
A testing strategy isn’t just about optimizing what exists – it’s about discovering what’s possible. When you approach it as a systematic learning laboratory rather than a random testing playground, you unlock exponential growth potential.
Stop running experiments. Start running a growth lab.
Ready to transform your growth strategy? Download our free Notion Experiment & Hypothesis Library Tracker to get started immediately. Your future self will thank you for building these capabilities today rather than waiting for the “perfect” moment that never comes.
Follow me on LinkedIn for daily growth insights.
Do you still have questions about implementing B2B or B2C testing strategies in your organization? I frequently receive these questions from founders, product leaders, and growth leaders. Here are the most common concerns, along with my practical answers, to help you transition from theory to execution.
B2B Testing Strategies FAQs
1. How long should B2B growth experiments typically run?
B2B experiments should run for at least one complete sales cycle to capture accurate results. For most B2B companies, this means a minimum of 30 to 90 days. However, track leading indicators on a weekly basis to catch major issues early.
2. What’s the ideal sample size for B2B growth experiments?
Unlike B2C, B2B experiments need smaller sample sizes due to higher transaction values. Aim for at least 100 conversions per variant for statistical significance, but focus more on qualitative insights from sales team feedback.
3. How do you handle seasonality in B2B growth experiments?
Account for quarterly budget cycles, holiday periods, and industry-specific seasons. Run experiments during “normal” periods first, then test how results change during seasonal variations.
4. Should B2B experiments focus on quantity or quality of leads?
Always prioritize lead quality over quantity. A 10% increase in high-quality leads beats a 50% increase in unqualified leads. Utilize lead scoring and sales team feedback to assess true quality accurately.
5. How do you get buy-in from sales teams for growth experiments?
Involve sales in experiment design and make them partners, not subjects. Share results transparently and show how experiments make their jobs easier, not harder.
6. What’s the biggest mistake B2B companies make with growth experiments?
Testing too many variables at once. B2B sales cycles are long, so you need clean data to understand what’s working. Test one primary variable at a time.
7. How do you measure the ROI of B2B growth experiments?
Track pipeline contribution, not just immediate conversions. Many B2B experiments show impact 3-6 months later. Use attribution modeling to connect experiments to closed deals.
8. Should different personas have different growth experiment approaches?
Absolutely. Decision-makers, influencers, and end-users respond to other messaging and offers. Segment your experiments by persona and buying stage.
9. How do you handle growth experiments with enterprise clients?
Enterprise experiments require more relationship management and longer timelines. Focus on pilot programs and gradually expand successful experiments to minimize disruptions to key relationships.
10. What tools are essential for B2B Testing Strategies?
You need: analytics (Google Analytics/Mixpanel), CRM integration (Salesforce/HubSpot), testing platform (Optimizely/VWO), and attribution tracking (Bizible/Dreamdata). Don’t over-tool – start simple and scale.
B2C Testing Strategies FAQs
1. How quickly can you see results from B2C growth experiments?
Most B2C experiments yield initial results within 7-14 days, primarily due to the higher volume of traffic. However, run experiments for at least 2-4 weeks to account for weekly patterns and ensure statistical significance.
2. What’s the minimum traffic needed for B2C growth experiments?
You need at least 1,000 visitors per variant per week for reliable results. If you have lower traffic, focus on higher-conversion pages or consider extending the experiment duration.
3. How do you prioritize growth experiments with limited resources?
Use the ICE-R framework ruthlessly. Focus on experiments that touch the most users (reach) and have the highest potential impact. Quick wins that boost confidence are also valuable in the early stages.
4. Should mobile and desktop be tested separately?
Yes, user behavior differs significantly between devices. Run separate experiments or ensure your testing platform can segment results by device type for accurate insights.
5. How do you handle growth experiments during app store review periods?
Plan experiments that don’t require app store approval first. Utilize server-side testing, web-based onboarding, or feature flags to conduct experiments without requiring app updates.
6. What’s the role of personalization in B2C growth experiments?
Personalization can significantly boost results, but start by targeting broad segments before becoming granular. Test location-based, behavior-based, or demographic-based personalization systematically.
7. How do you measure the impact of viral growth experiments?
Track the viral coefficient (users invited per active user) and the viral cycle time (the time from invitation to activation). Focus on experiments that improve both metrics simultaneously.
8. Should you test price changes as growth experiments?
Yes, but carefully. Test price changes on new user cohorts first, and continuously measure impact on both acquisition and retention. Consider psychological pricing principles.
9. How do you handle growth experiments that might hurt user experience?
Always include user experience metrics in your experiment tracking. If an experiment boosts conversions but hurts retention or satisfaction, it’s not a true win.
10. What’s the best way to learn from failed B2C growth experiments?
Focus on understanding user behavior patterns, not just conversion rates. Use heatmaps, user recordings, and qualitative feedback to understand why experiments failed. Failed experiments often reveal user insights that lead to bigger wins.
Related Articles
The Ultimate B2C Growth Metrics Guide to Explode Your Revenue – Guide Part 1
B2C Brand Health Metrics Guide: Unlock Growth Now – Guide Part 2
How to Create a Winning Data-Driven Sales Strategy
Proven B2B Outreach Strategy That Gets Real Results
The Ultimate B2B Revenue Metrics Guide for Leaders – Guide Part 1
The Ultimate B2B Efficiency Metrics Playbook for Leaders – Guide Part 2
B2B Metric Frameworks Infographics: Unlock Growth & Profits Now
About the Author
I write about:
- AI + MarTech Automation
- AI Strategy
- COO Ops & Systems
- Growth Strategy (B2B & B2C)
- Infographic
- Leadership & Team Building
- My Case Studies
- Personal Journey
- Revenue Operations (RevOps)
- Sales Strategy
- SEO & Digital Marketing
- Strategic Thinking
📩 Want 1:1 strategic support?
🔗 Connect with me on LinkedIn
📬 Read my playbooks on Substack
Leave a Reply